DWH Management
The Data Warehouse Cluster Management feature in Amorphic is a tool that helps you manage and monitor your data warehouse. It allows you to see important information about your data warehouse, such as how it's performing and what type of data it's storing.
You can use it to perform actions on your data warehouse, like creating backups and restarting it.
A simplified view of some of the key cluster metrics Ex: CPU Utilization, DB Connection Counts, Disk Space etc.
Facilitates cluster operations like creating snapshot, update maintenance and reboot etc.
It also provides additional capabilities for redshift type DWH such as:
- running administrative operations on tables
- scheduling actions on the cluster
- enabling or disabling users to list schemas and tables within a tenant
For example, the feature allows the administrator to prevent users from seeing all the tables or schemas in a database, but they can still access the data by running queries. This is useful in situations where certain information needs to be restricted. By default, this option is enabled for all users in a non-multi tenancy environment and enabled for authorized users in a multi-tenancy environment.
It also provides information about the cluster node types and security configurations.
Overall, this feature makes it easy to manage and keep track of your data warehouse.

Redshift Serverless
Amorphic DWH management extends its support for Redshift Serverless as well.
With Amazon Redshift Serverless,
- Namespaces and workgroups are used to manage storage and compute resources separately. This is equivalent to cluster identifier in Redshift provisioned server.
- Node types or node count are not applicable.
- Pause/ Resume/ Restart are not applicable here as we pay only when queries run.
- Schedules are not applicable since there is no maintenance window.
- List of all snapshots being created are displayed in the UI.
- Recovery points are created every 30 minutes and saved for 24 hours. Latest Recovery point is being shown in the UI.
- WLM Queues are not applicable.
- List of supported metrics can be found in the below section.
- Currently, Bulk data load ingestion is not supported
Metrics
Amorphic DWH management cluster provides an option to view time line based cluster metrics, which helps in understanding and managing the system. You can filter the metrics by time range, between 30 minutes to a week, to quickly view the metrics. The default view is the last 30 minutes metrics.
Below are the available metrics:
Redshift Provisioned
- Commit Queue Length
- Number of transactions waiting to commit at a given point in time.
- Units: Count
- Concurrency Scaling Active Clusters
- Number of concurrency scaling clusters that are actively processing queries at any given time.
- Units: Count
- Concurrency Scaling Seconds
- Number of seconds used by concurrency scaling clusters that have active query processing activity.
- Units: Count
- CPU Utilization
- Shows the percentage of CPU utilization for all nodes.
- Units: Percent
- Database Connection Count
- The number of database connections to a cluster.
- Units: Count
- Health Status
- Indicates the health of the cluster.
- Units: Count( 1-HEALTHY / 0-UNHEALTHY ).
- Maintenance Mode
- Indicates whether the cluster is in maintenance mode.
- Units: Count( 1-ON / 0-OFF ).
- Max Configured Concurrency Scaling Clusters
- Maximum number of concurrency scaling clusters configured from the parameter group.
- Units: Count
- Network Receive Throughput
- The rate at which the node or cluster receives data.
- Units: Bytes/Second
- Network Transmit Throughput
- The rate at which the node or cluster writes data.
- Units: Bytes/Second
- Percentage Disk Space Used
- The percent of disk space used.
- Units: Percent
- Read IOPS
- The average number of disk read operations per second.
- Units: Count/Second
- Read Latency
- The average amount of time taken for disk read I/O operations.
- Units: Seconds
- Read Throughput
- The average number of bytes read from disk per second.
- Units: Bytes/Second
- Redshift Managed Storage Total Capacity
- Total managed storage capacity.
- Units: Megabytes
- Total Table Count
- The number of user tables (excluding Amazon Redshift Spectrum tables) open at a particular point in time.
- Units: Count
- Write IOPS
- The average number of write operations per second.
- Units: Count/Second
- Write Latency
- The average amount of time taken for disk write I/O operations.
- Units: Seconds
- Write Throughput
- The average number of bytes written to disk per second.
- Units: Bytes/Second
- Num Exceeded Schema Quotas
- The number of schemas with exceeded quotas.
- Units: Count
Redshift Serverless
- Database Connection Count
- The number of database connections at a point in time.
- Units: Count
- Compute Capacity
- Average number of compute units allocated during the past 30 minutes.
- Units: Count
- Compute Seconds
- Accumulated compute-unit seconds used in the last 30 minutes.
- Units: Count
- Total Table Count
- Number of user tables (excluding Amazon Redshift Spectrum tables) existing at a point in time.
- Units: Count
- Data Storage
- Number of megabytes used, in disk or storage space, for Redshift data.
- Units: Megabytes
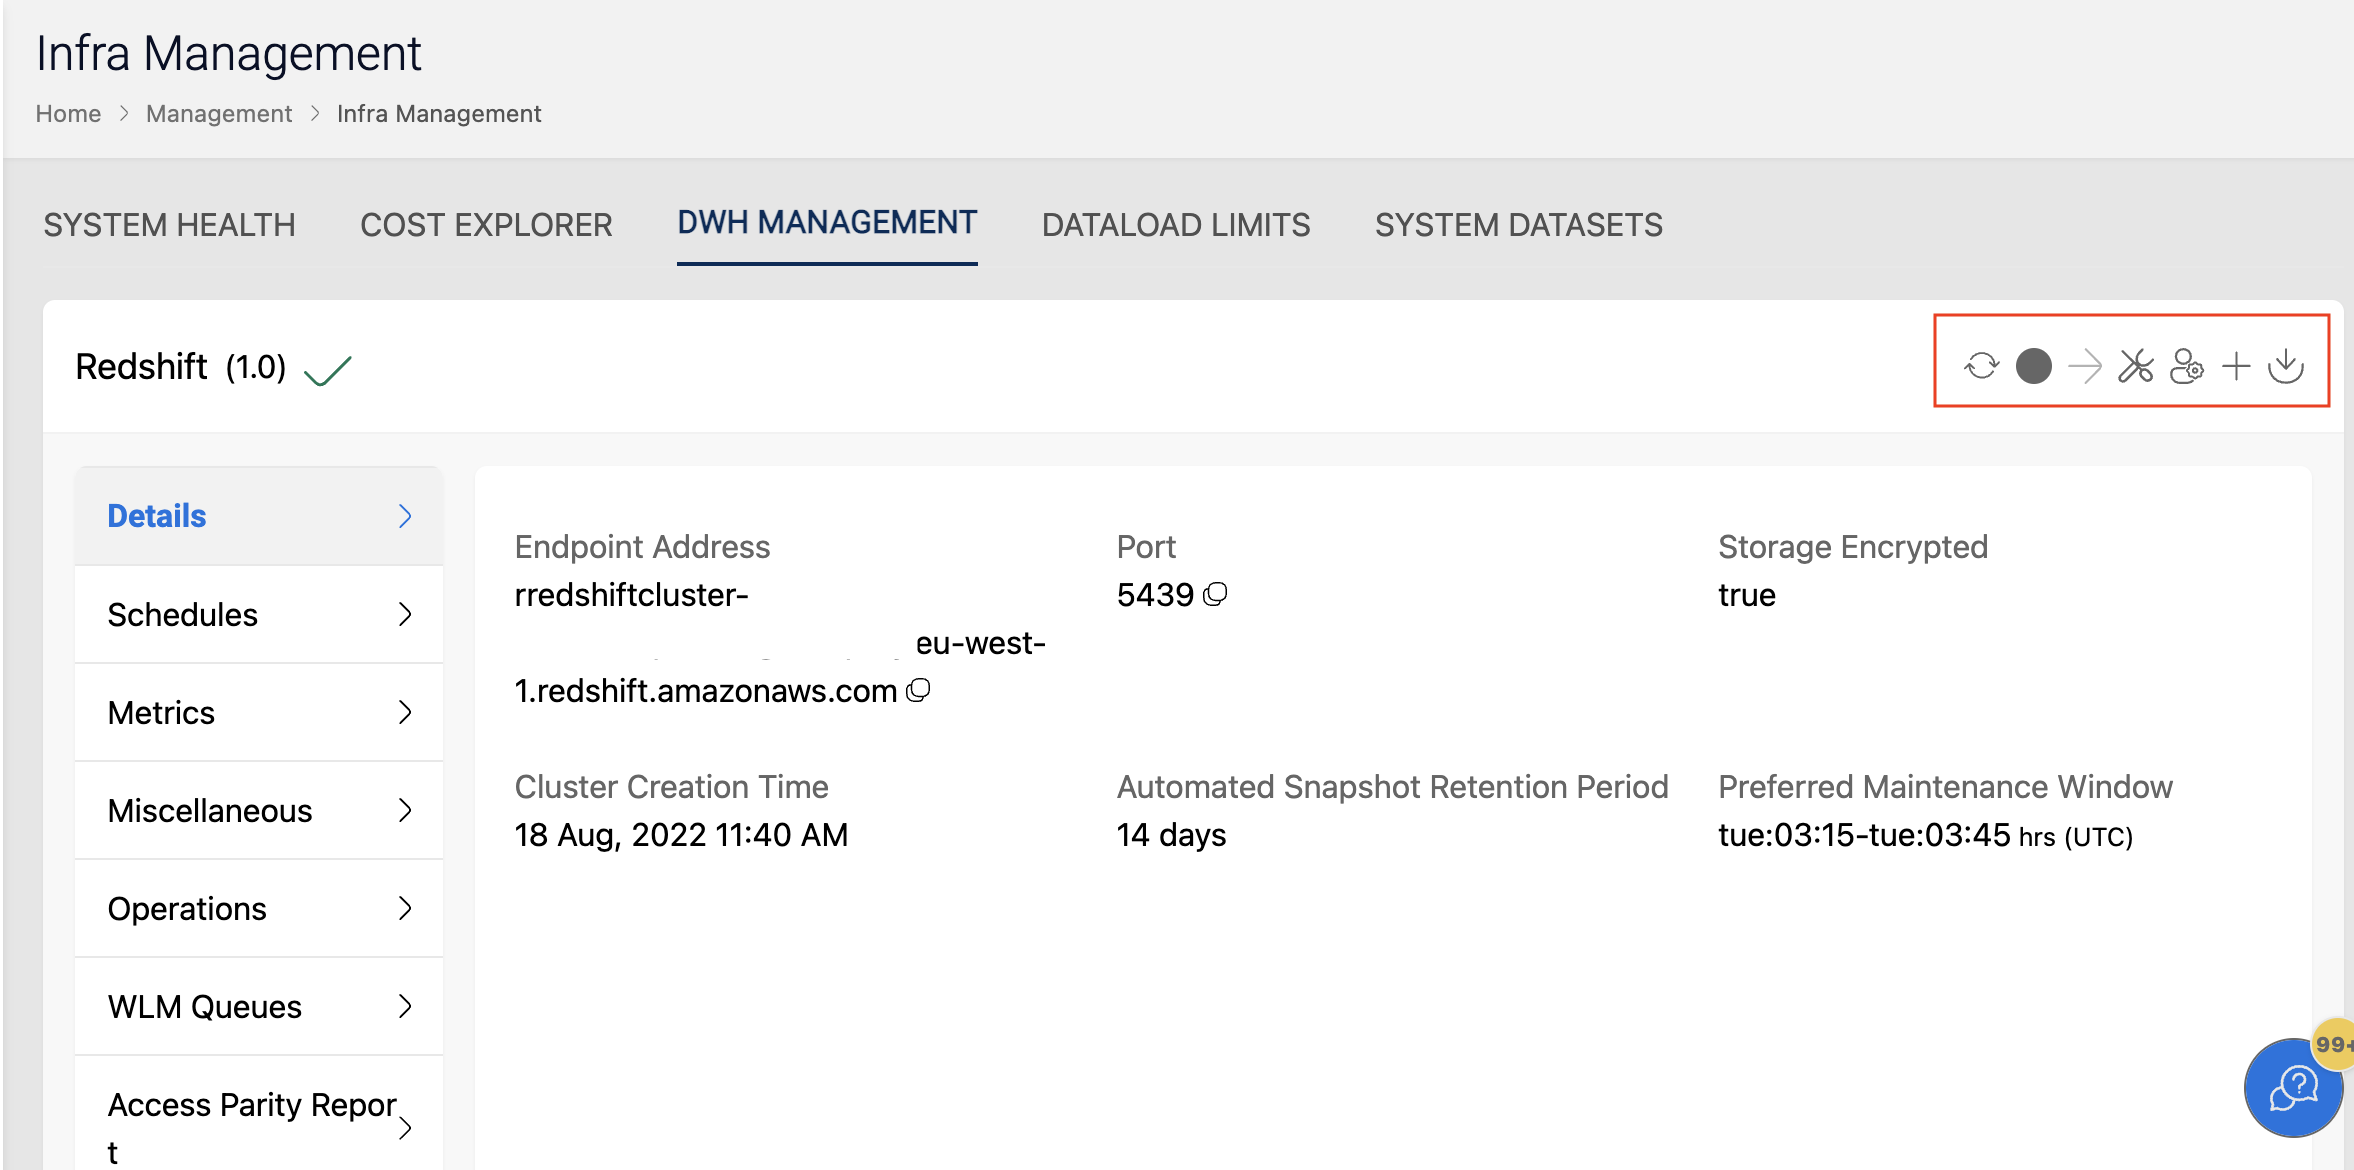
Operations
Amorphic DWH management cluster console provides a handful of key operations such as:
- Creating a snapshot
- Update cluster maintenance window ( Not applicable for Redshift Serverless )
- Reboot cluster ( Not applicable for Redshift Serverless )
- Pause and Resume cluster ( only for Redshift Provisioned cluster )
- Running Vacuuming on tables ( Applicable for Redshift Provisioned and Serverless )
- Running System Administrator queries ( Applicable for Redshift Provisioned and Serverless )
- DWH Metadata Access ( Applicable for Redshift Provisioned and Serverless )
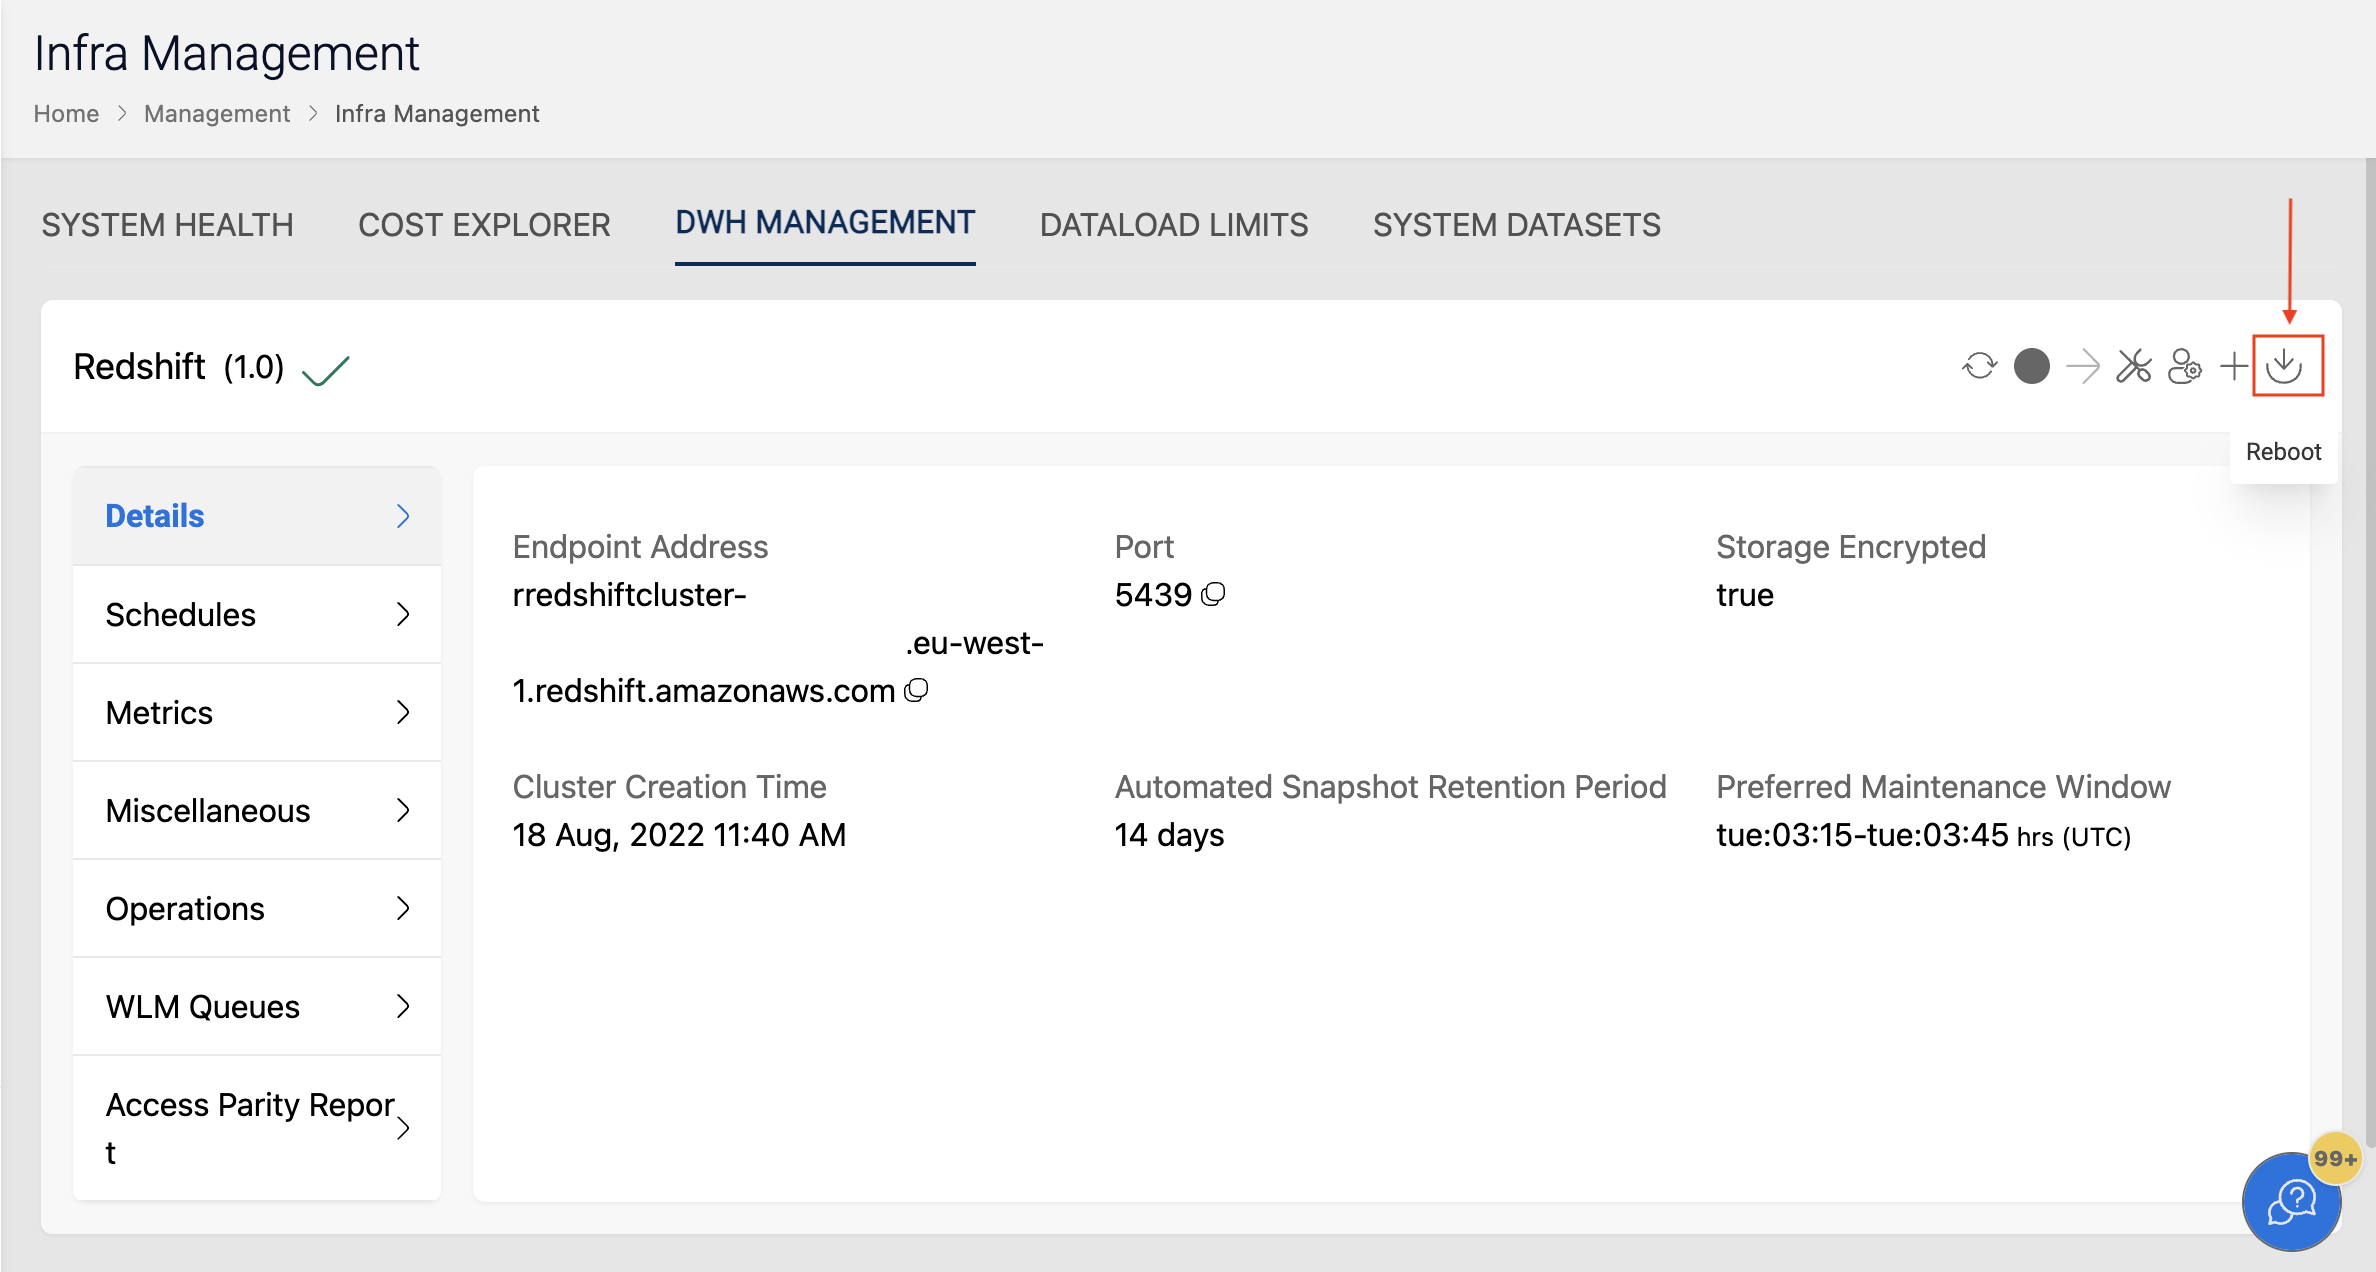
The following picture depicts the DWH Management Console Actions in Amorphic:
Creating Snapshot
Management console allows you to create manual snapshots with customizable retention period of the cluster. Valid retention period is between 1-3653 days.
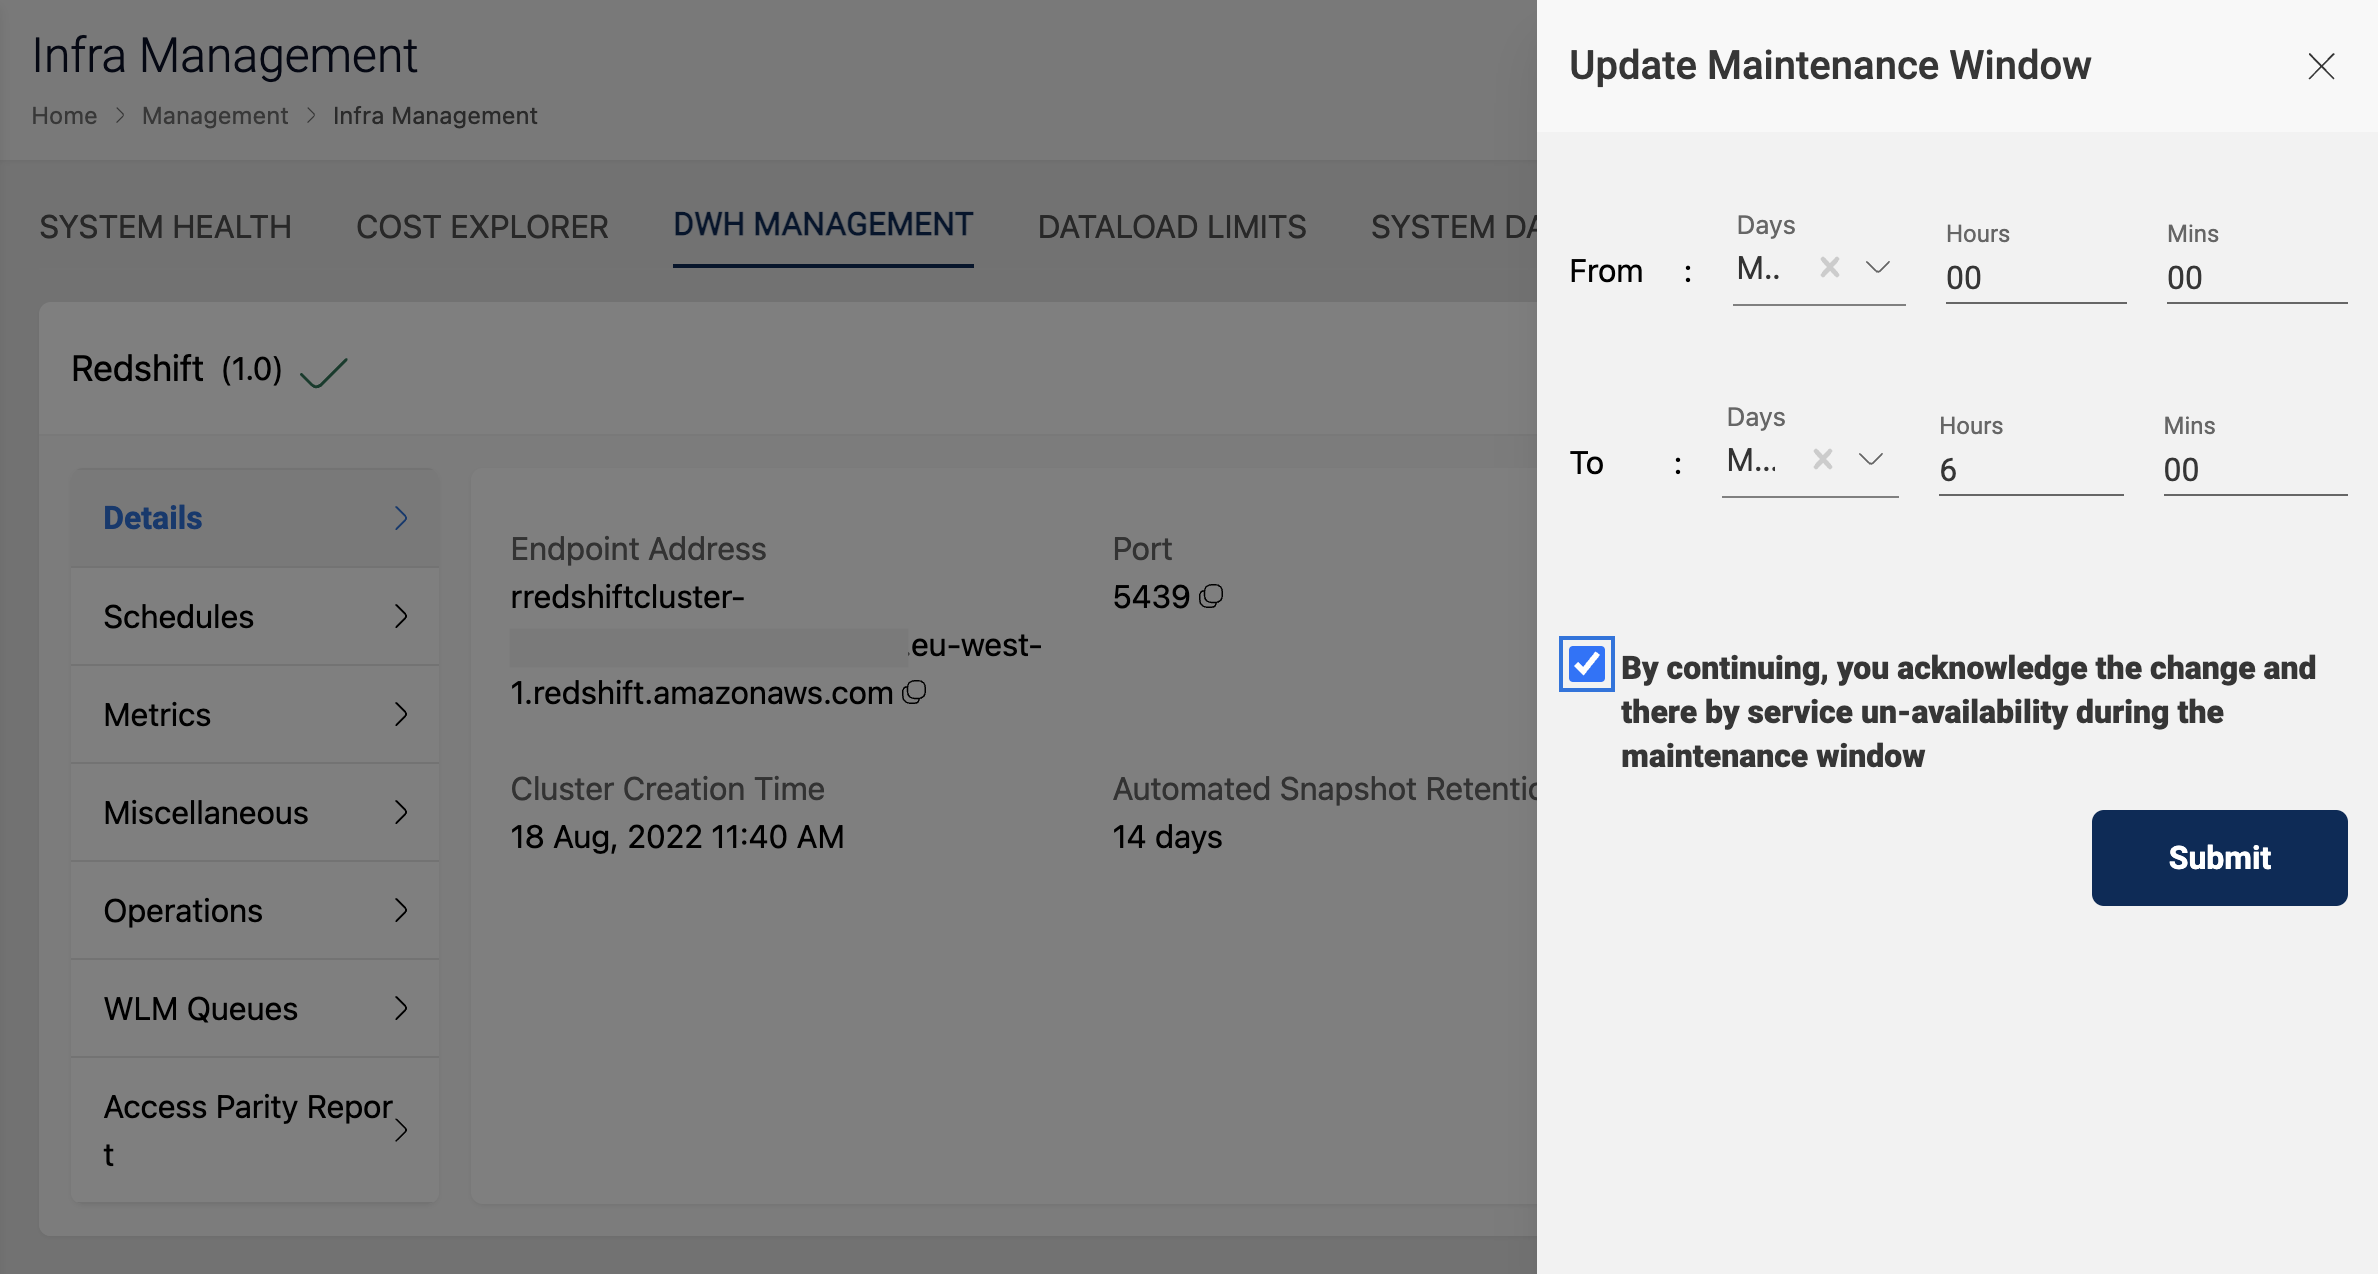
Update cluster maintenance window
Enables you to update the scheduled cluster maintenance window. Supported format : ddd:HH:MM-ddd:HH:MM
Rebooting Cluster
Enables you to reboot an active cluster.
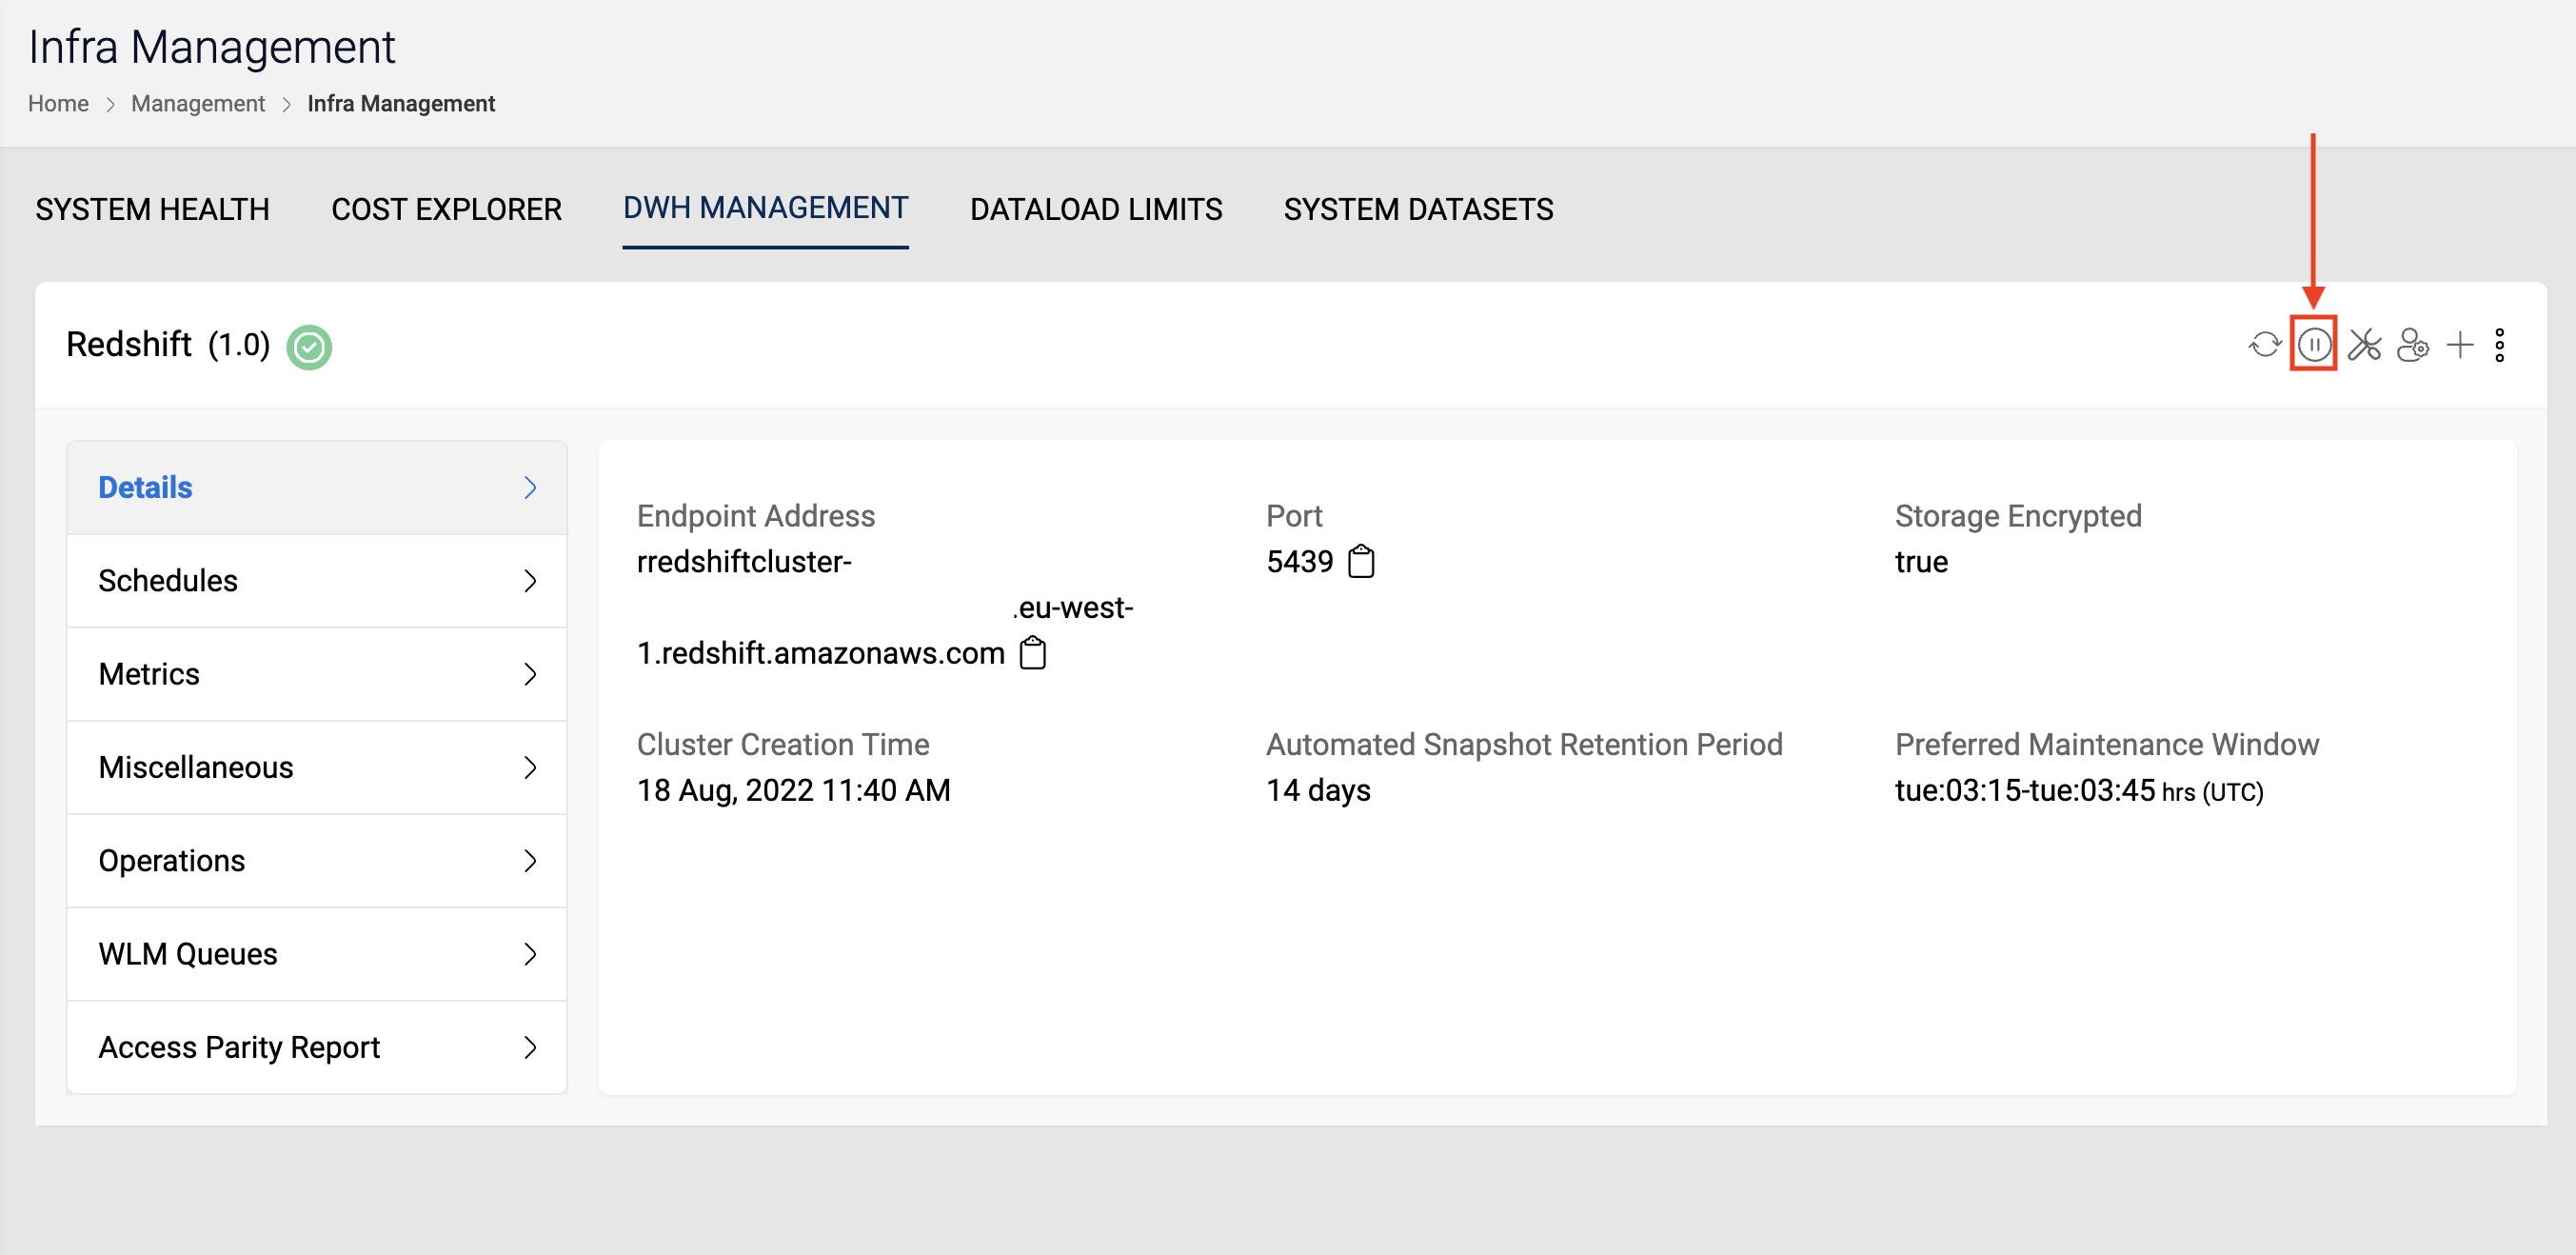
Pause and Resume Cluster
Amorphic management console allows you to pause and resume their redshift cluster. This option is only supported for redshift type DW clusters. To pause/resume the cluster click on the pause/resume button as shown in the image below.
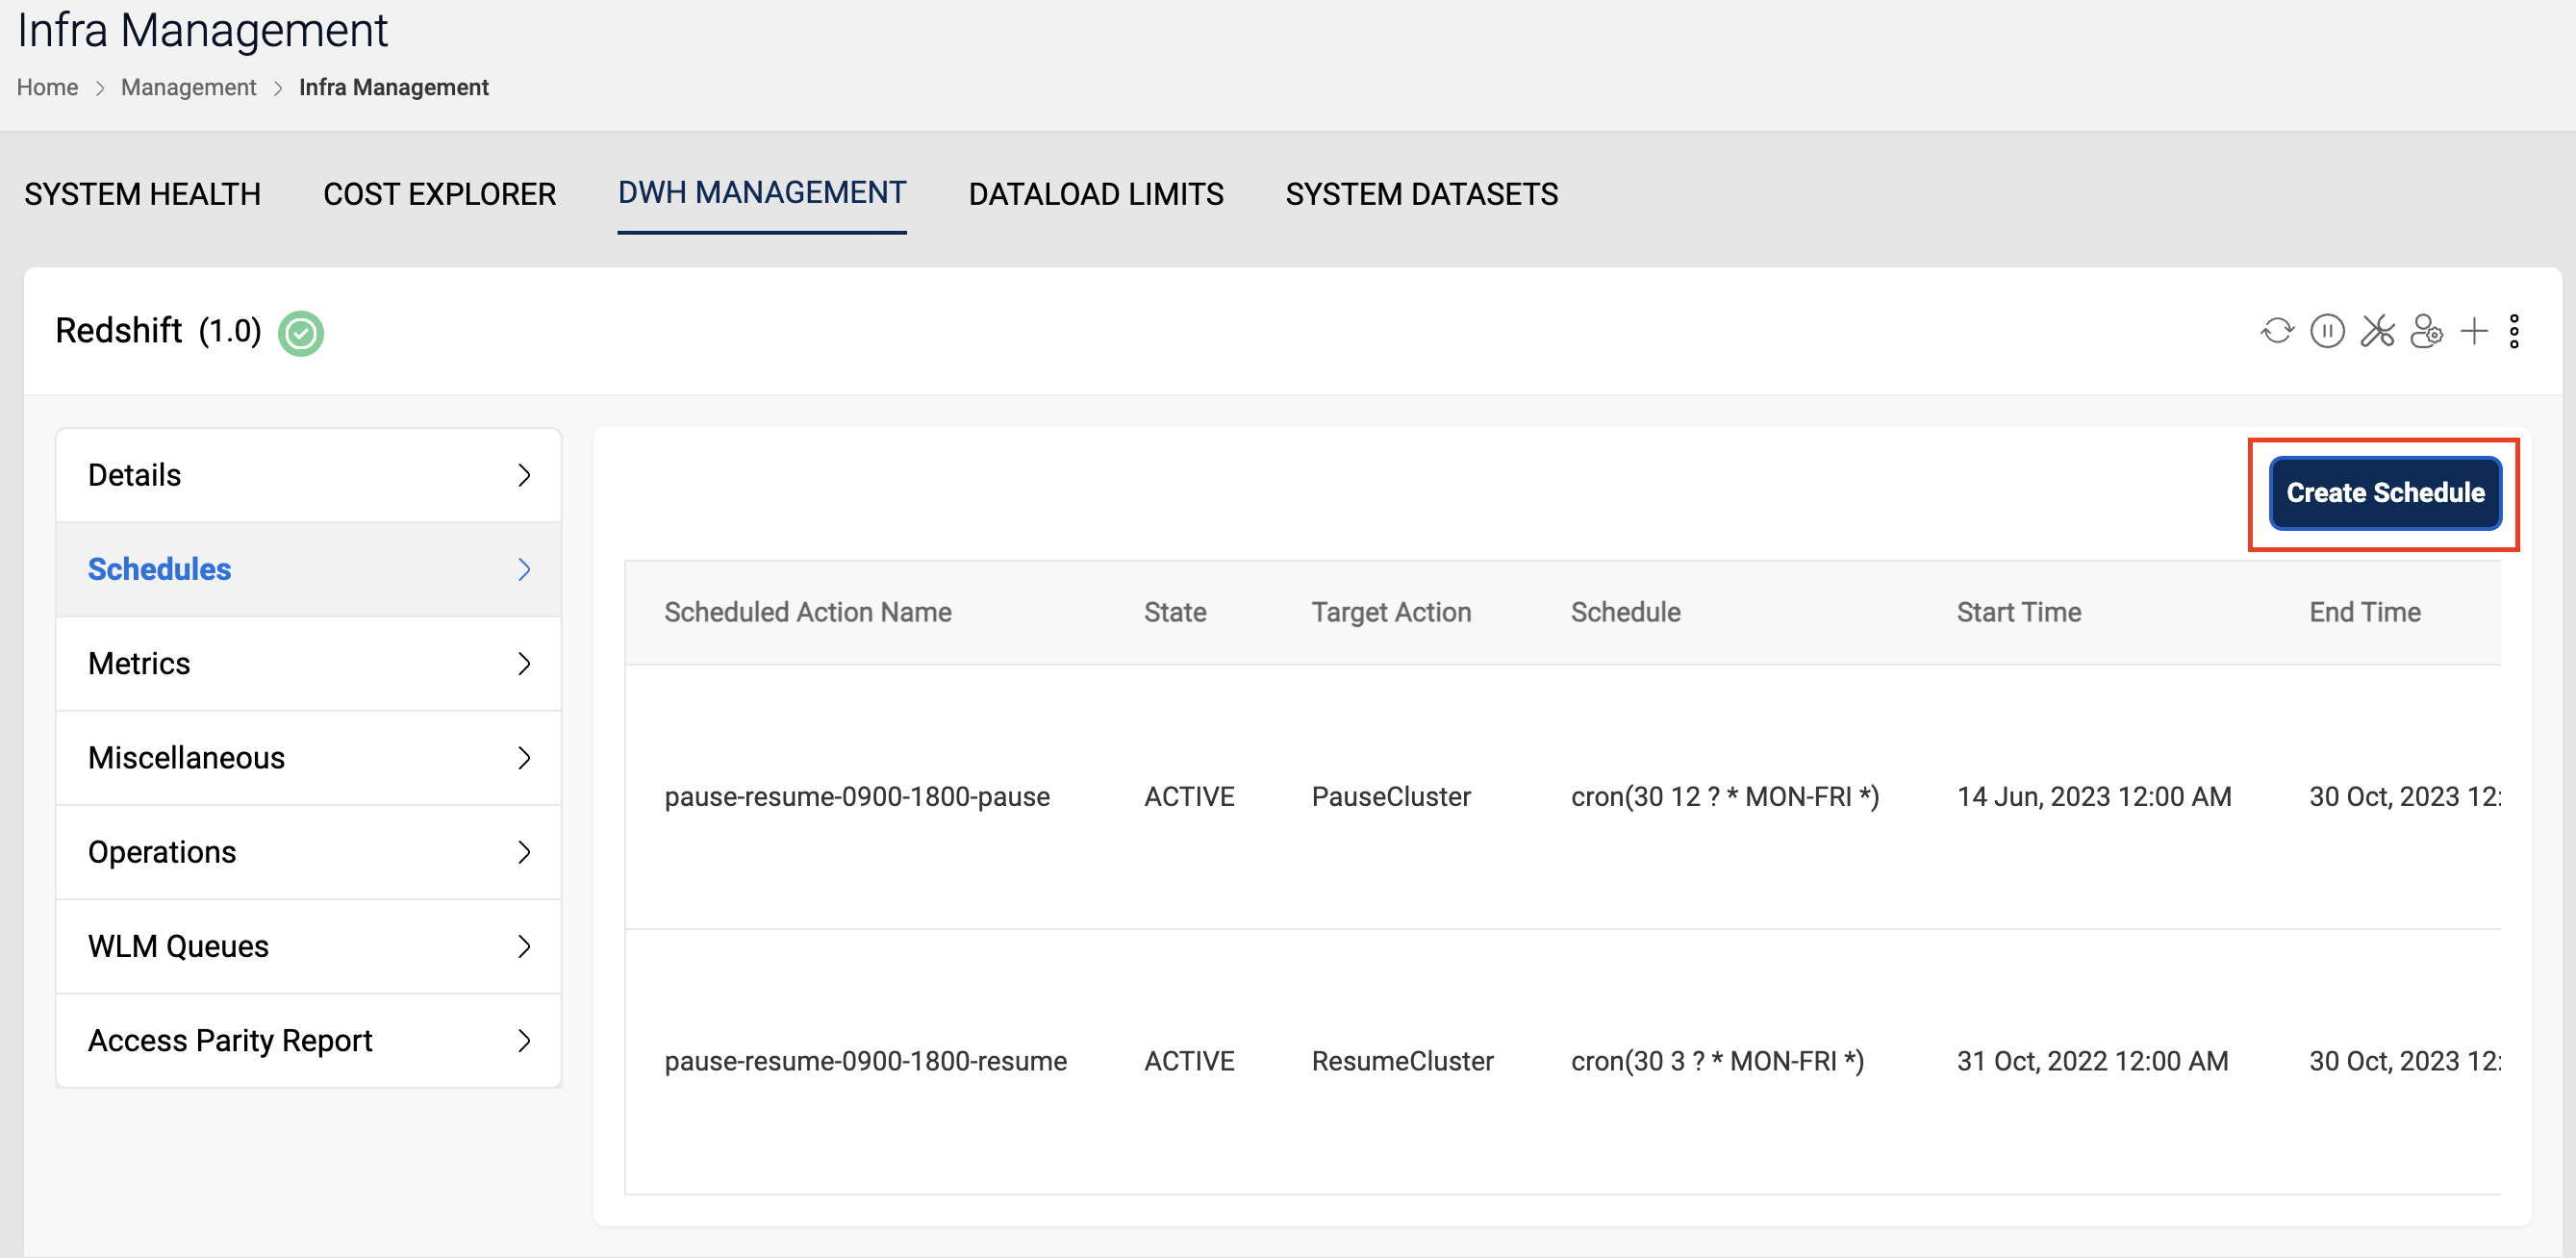
Pause/Resume Schedule
To create a pause/resume schedule click on the schedules tab and then click on Create Schedule button, in the dwh management section. The supported actions are:
- Pause Later: Pause the cluster at a given time stamp (at format) or recurring (cron format) schedule
- Resume Later: Resume the cluster at a given time stamp (at format) or recurring (cron format) schedule
- Pause and Resume Later: Schedule a pause and resume action at a defined period. Example : Pause on every friday 10:00 PM and resume on monday morning 9:00 AM
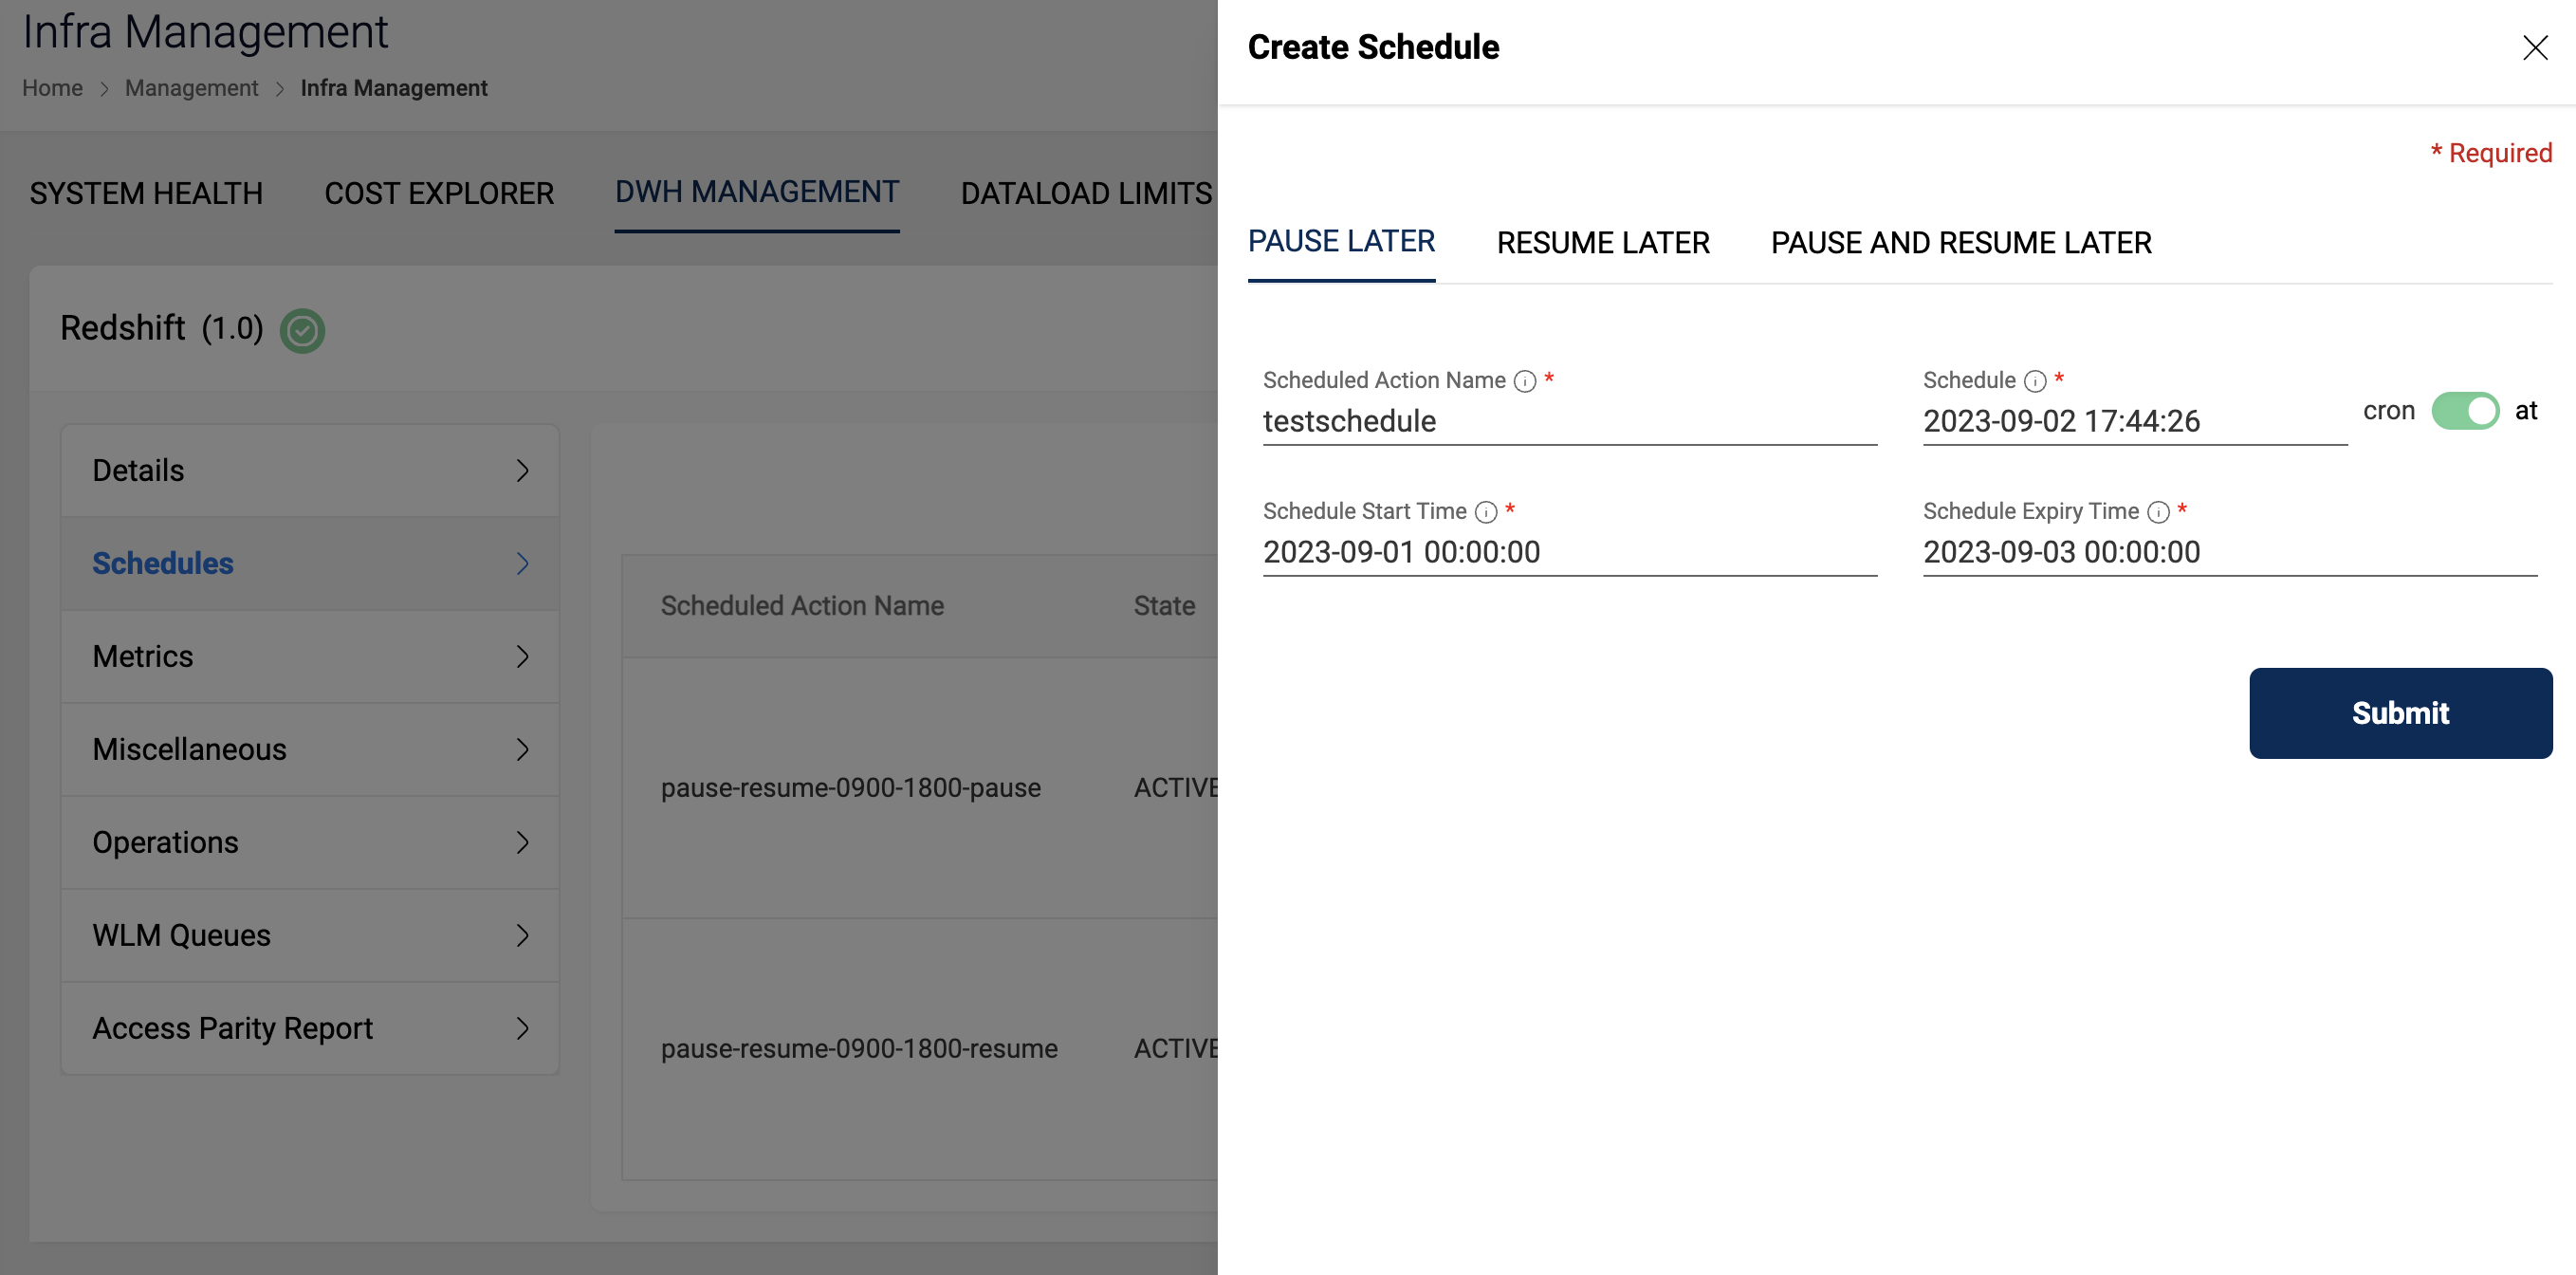
- Format of at expressions is "at(yyyy-mm-ddThh:mm:ss)". For example, "at(2016-03-04T17:27:00)".
- Format of cron expressions is "cron(Minutes Hours Day-of-month Month Day-of-week Year)". For example, "cron(0 10 ? MON )".
Vacuuming
Amorphic allows you to run a process called vacuuming on database tables, which helps to free up space and improve performance. This process is only available for redshift cluster type backend. Amorphic support different types of vacuuming, such as:
FULL: This is the default option, it reclaims disk space occupied by rows that were marked for deletion by previous UPDATE and DELETE operations.
SORT ONLY: This option sorts the specified table without reclaiming space freed by deleted rows.
DELETE ONLY: This option reclaims disk space occupied by rows that were marked for deletion by previous UPDATE and DELETE operations, and compacts the table to free up the consumed space. It doesn't sort table data.
REINDEX: This option analyzes the distribution of the values in interleaved sort key columns, then performs a full VACUUM operation. It is not supported with TO threshold PERCENT.
Threshold Percent is a clause that specifies the threshold above which VACUUM skips the sort phase and the target threshold for reclaiming space in the delete phase.
Administrator Queries
Enables you to run administrator level queries on the database cluster. Amorphic supports the following actions
- Query System Tables : Fetch table load, Work load management, S3 client errors and list table locks. Amorphic provides advanced querying options to enable conditional filtering of the results. For example, a user can fetch work load errors based on the error code or message.
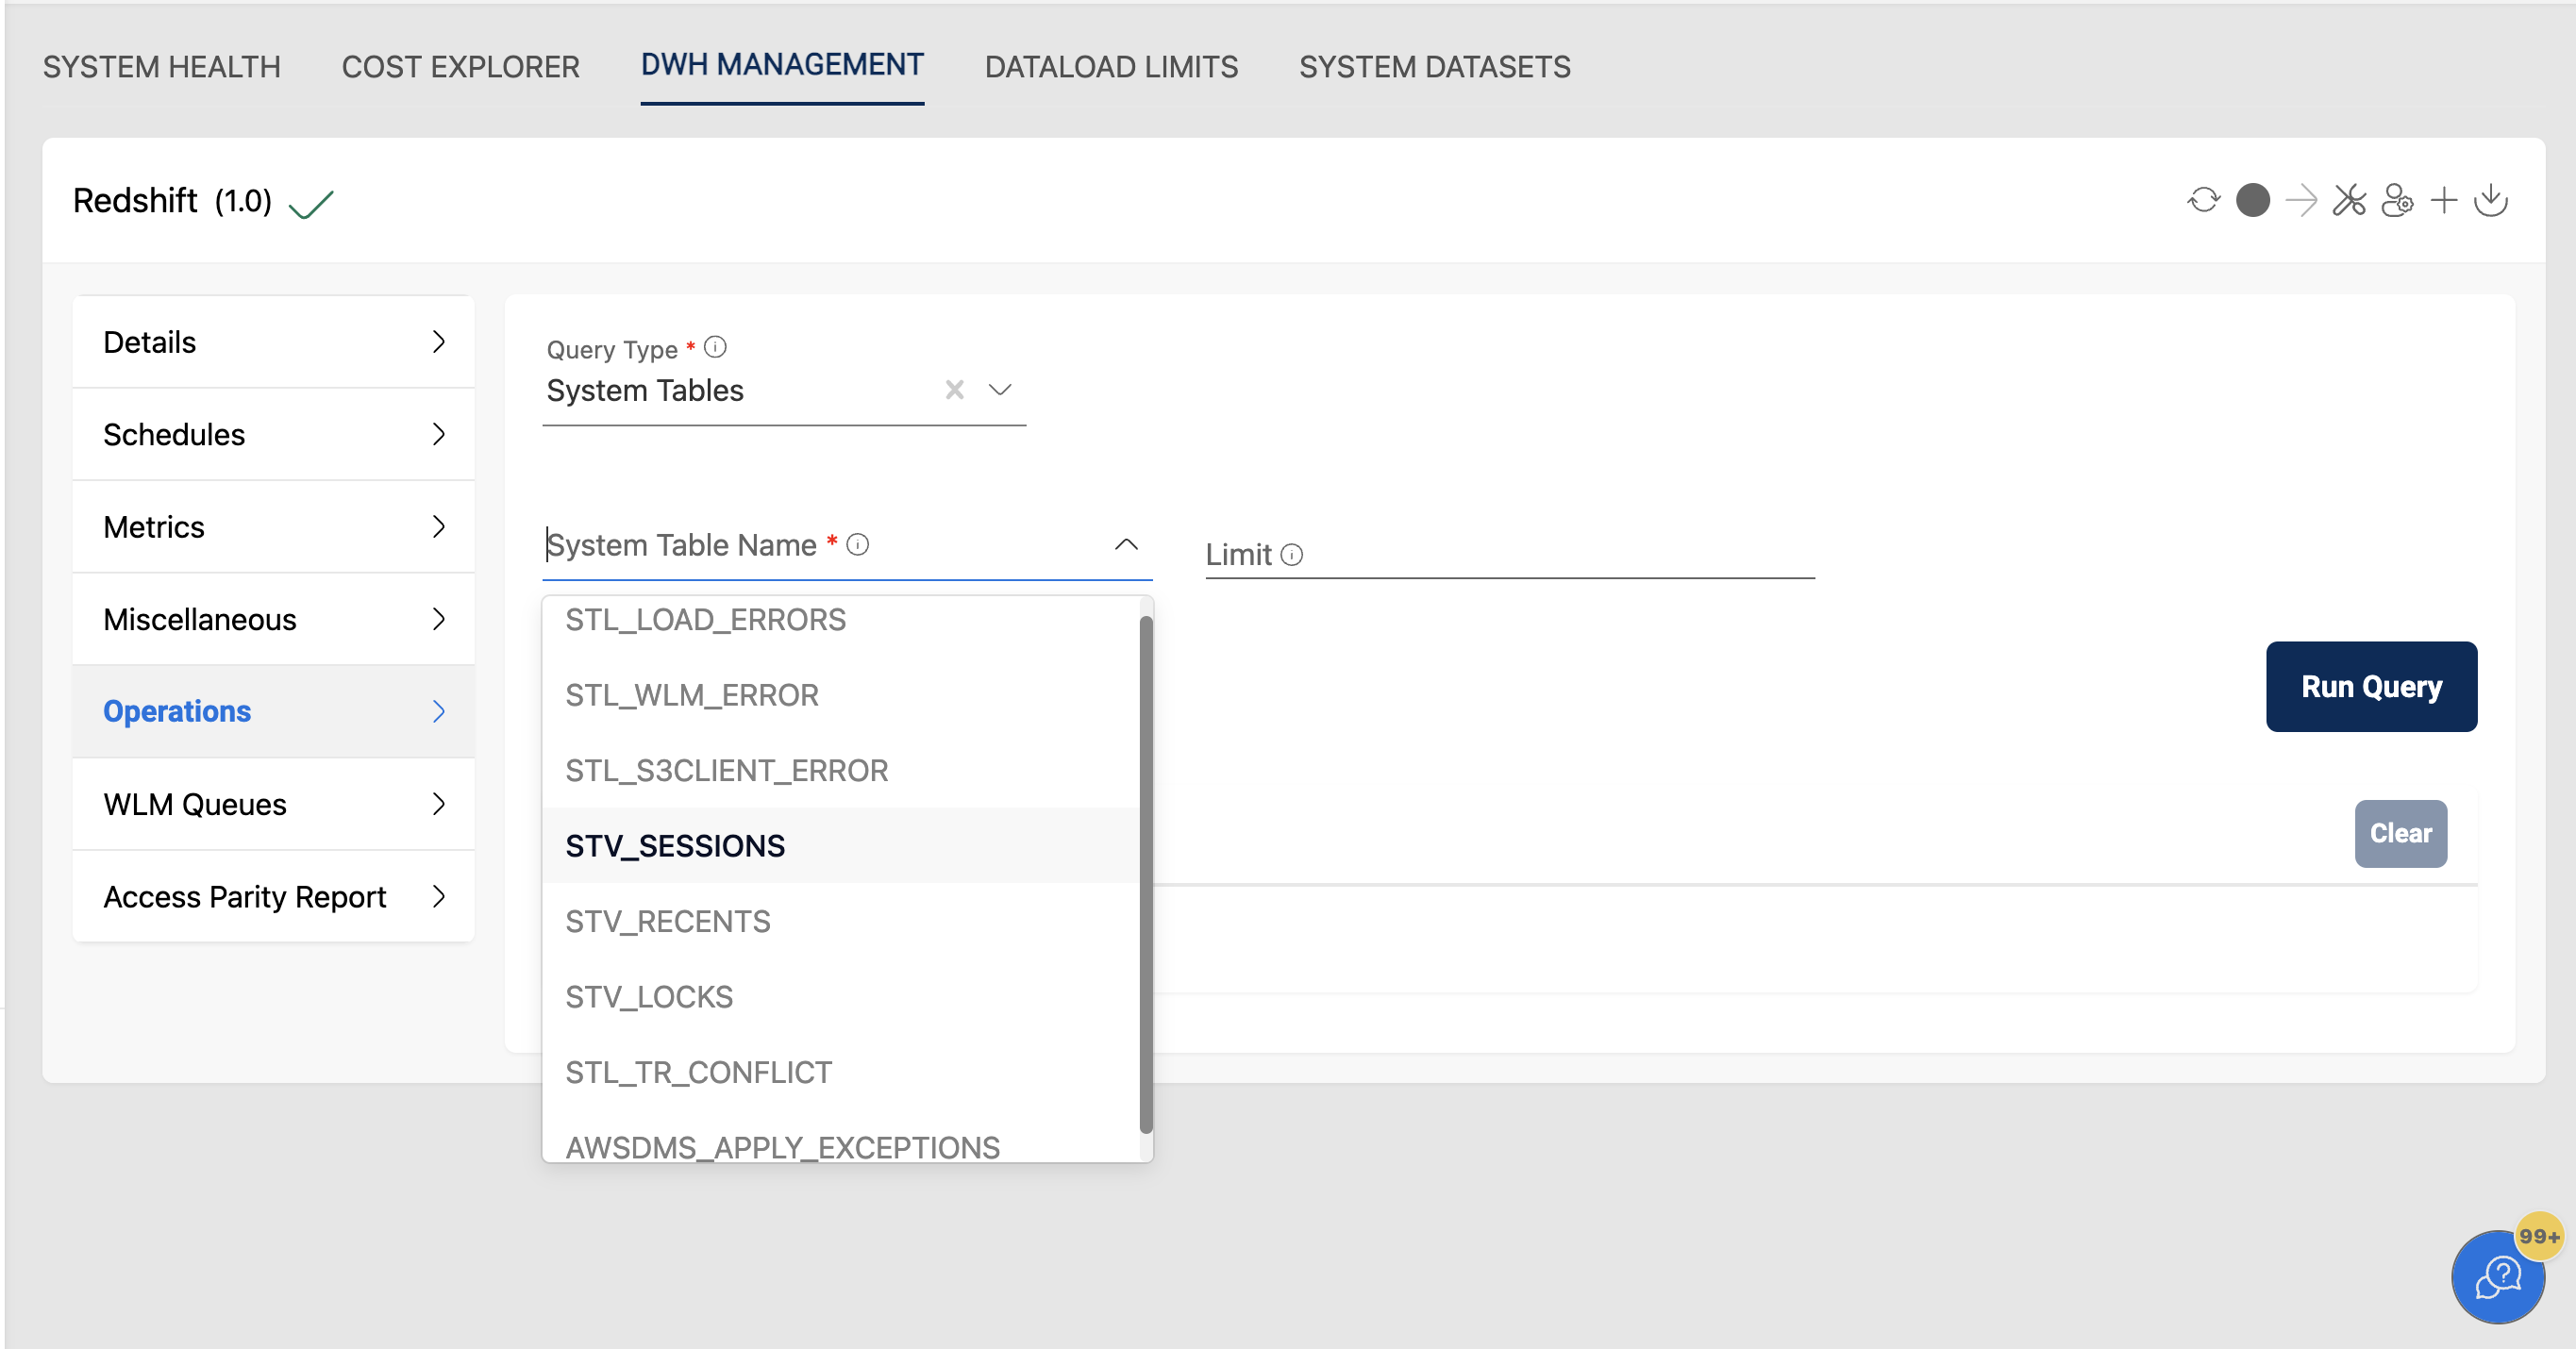
Query System tables
Amorphic allows querying the following system tables
STL_LOAD_ERRORS : Contains a history of all Redshift load errors.
STL_S3CLIENT_ERROR : Records errors encountered by a slice while loading a file from Amazon S3.
STL_WLM_ERROR : Records all Work load management related errors as they occur.
STL_TR_CONFLICT : Records all transaction conflicts with database tables.
STV_SESSIONS : Lists all current active cluster connections.

STV_RECENTS : Lists all current running queries.
STV_LOCKS : Lists all existing table locks.
AWSDMS_APPLY_EXCEPTIONS : Provides information about DMS exceptions
STL_LOAD_ERROR_DETAIL : Contains a history of all Redshift load errors.
SYS_CONNECTION_LOG : Lists all current active cluster connections.
SYS_QUERY_HISTORY : Lists all current running queries.
For Redshift Serverless only SYS_CONNECTION_LOG, SYS_QUERY_HISTORY and SYS_LOAD_ERROR_DETAIL system tables are available.
Kill Sessions/Queries
Amorphic allows user to kill the sessions and queries.
Queries/Loads
This section provides information about queries and loads that run in the database. You can use this information to identify and troubleshoot queries that take a long time to process and that create bottlenecks preventing other queries from processing efficiently.
User can filter the results based on the following filters:
- All: Returns all the queries that ran in the specified duration
- Completed: Returns the successful queries
- Aborted: Returns the queries that were aborted
- Short: Returns queries which took less than 10 seconds to execute
- Medium: Returns queries which took more than 10 sec but less than 10 minutes to execute
- Long: Return queries which took more than 10 minutes to execute
- Loads: Returns the load queries
- Top 100: Returns the top 100 queries by duration
DWH Metadata Access
Amorphic allows user to Enable/disable DWH users to list schemas, tables inside an authorized tenant.
User can list and choose the authorized tenant which it is a part of and update the user catalog access.
WLM Queues
Amorphic management console allows you to create, edit and delete Redshift Workload Management queues so that user queries are appropriately routed and picked based on the priority of the user's work.
When you turn on concurrency scaling, Amazon Redshift will automatically add more power to your cluster to handle an increase in read and write queries. You can set the priority of your queries in a queue by giving them a priority value. This priority is set for the whole queue and applies to all the queries in that queue.
As part of managing your workload, you can also set up rules to monitor your queries. These rules use metrics to define how your queries should perform and what should happen if they don't meet those performance standards.
Each rule can have up to three conditions, or things to check for, and one action to take if the conditions are met. These conditions check for a metric, like how long a query takes, and compare it to a value using =, <, or >. The actions that can be taken if the conditions are met are to log the query, to stop it, or to change its priority.
Here are the different metrics you can use in your rules and their minimum and maximum values
| Metric Name | Min Value | Max Value |
|---|---|---|
| Query Execution Time | 0 | 86399 |
| Query Queue Time | 0 | 86399 |
| Query CPU Time | 0 | 999999 |
| Blocks Read | 0 | 1048575 |
| Scan Row Counts | 0 | 999999999999999 |
| Memory to Disk | 0 | 319815679 |
| CPU Skew | 0 | 99 |
| I/O Skew | 0 | 99 |
| Rows Joined | 0 | 999999999999999 |
| Nested Loop Join in Row Count | 0 | 999999999999999 |
- A maximum of 15 queues can be created.
- An overall of 25 rules can be applied on all queues
- There can be maximum 3 predicates per rule
- WLM Queues not applicable for Redshift Serverless
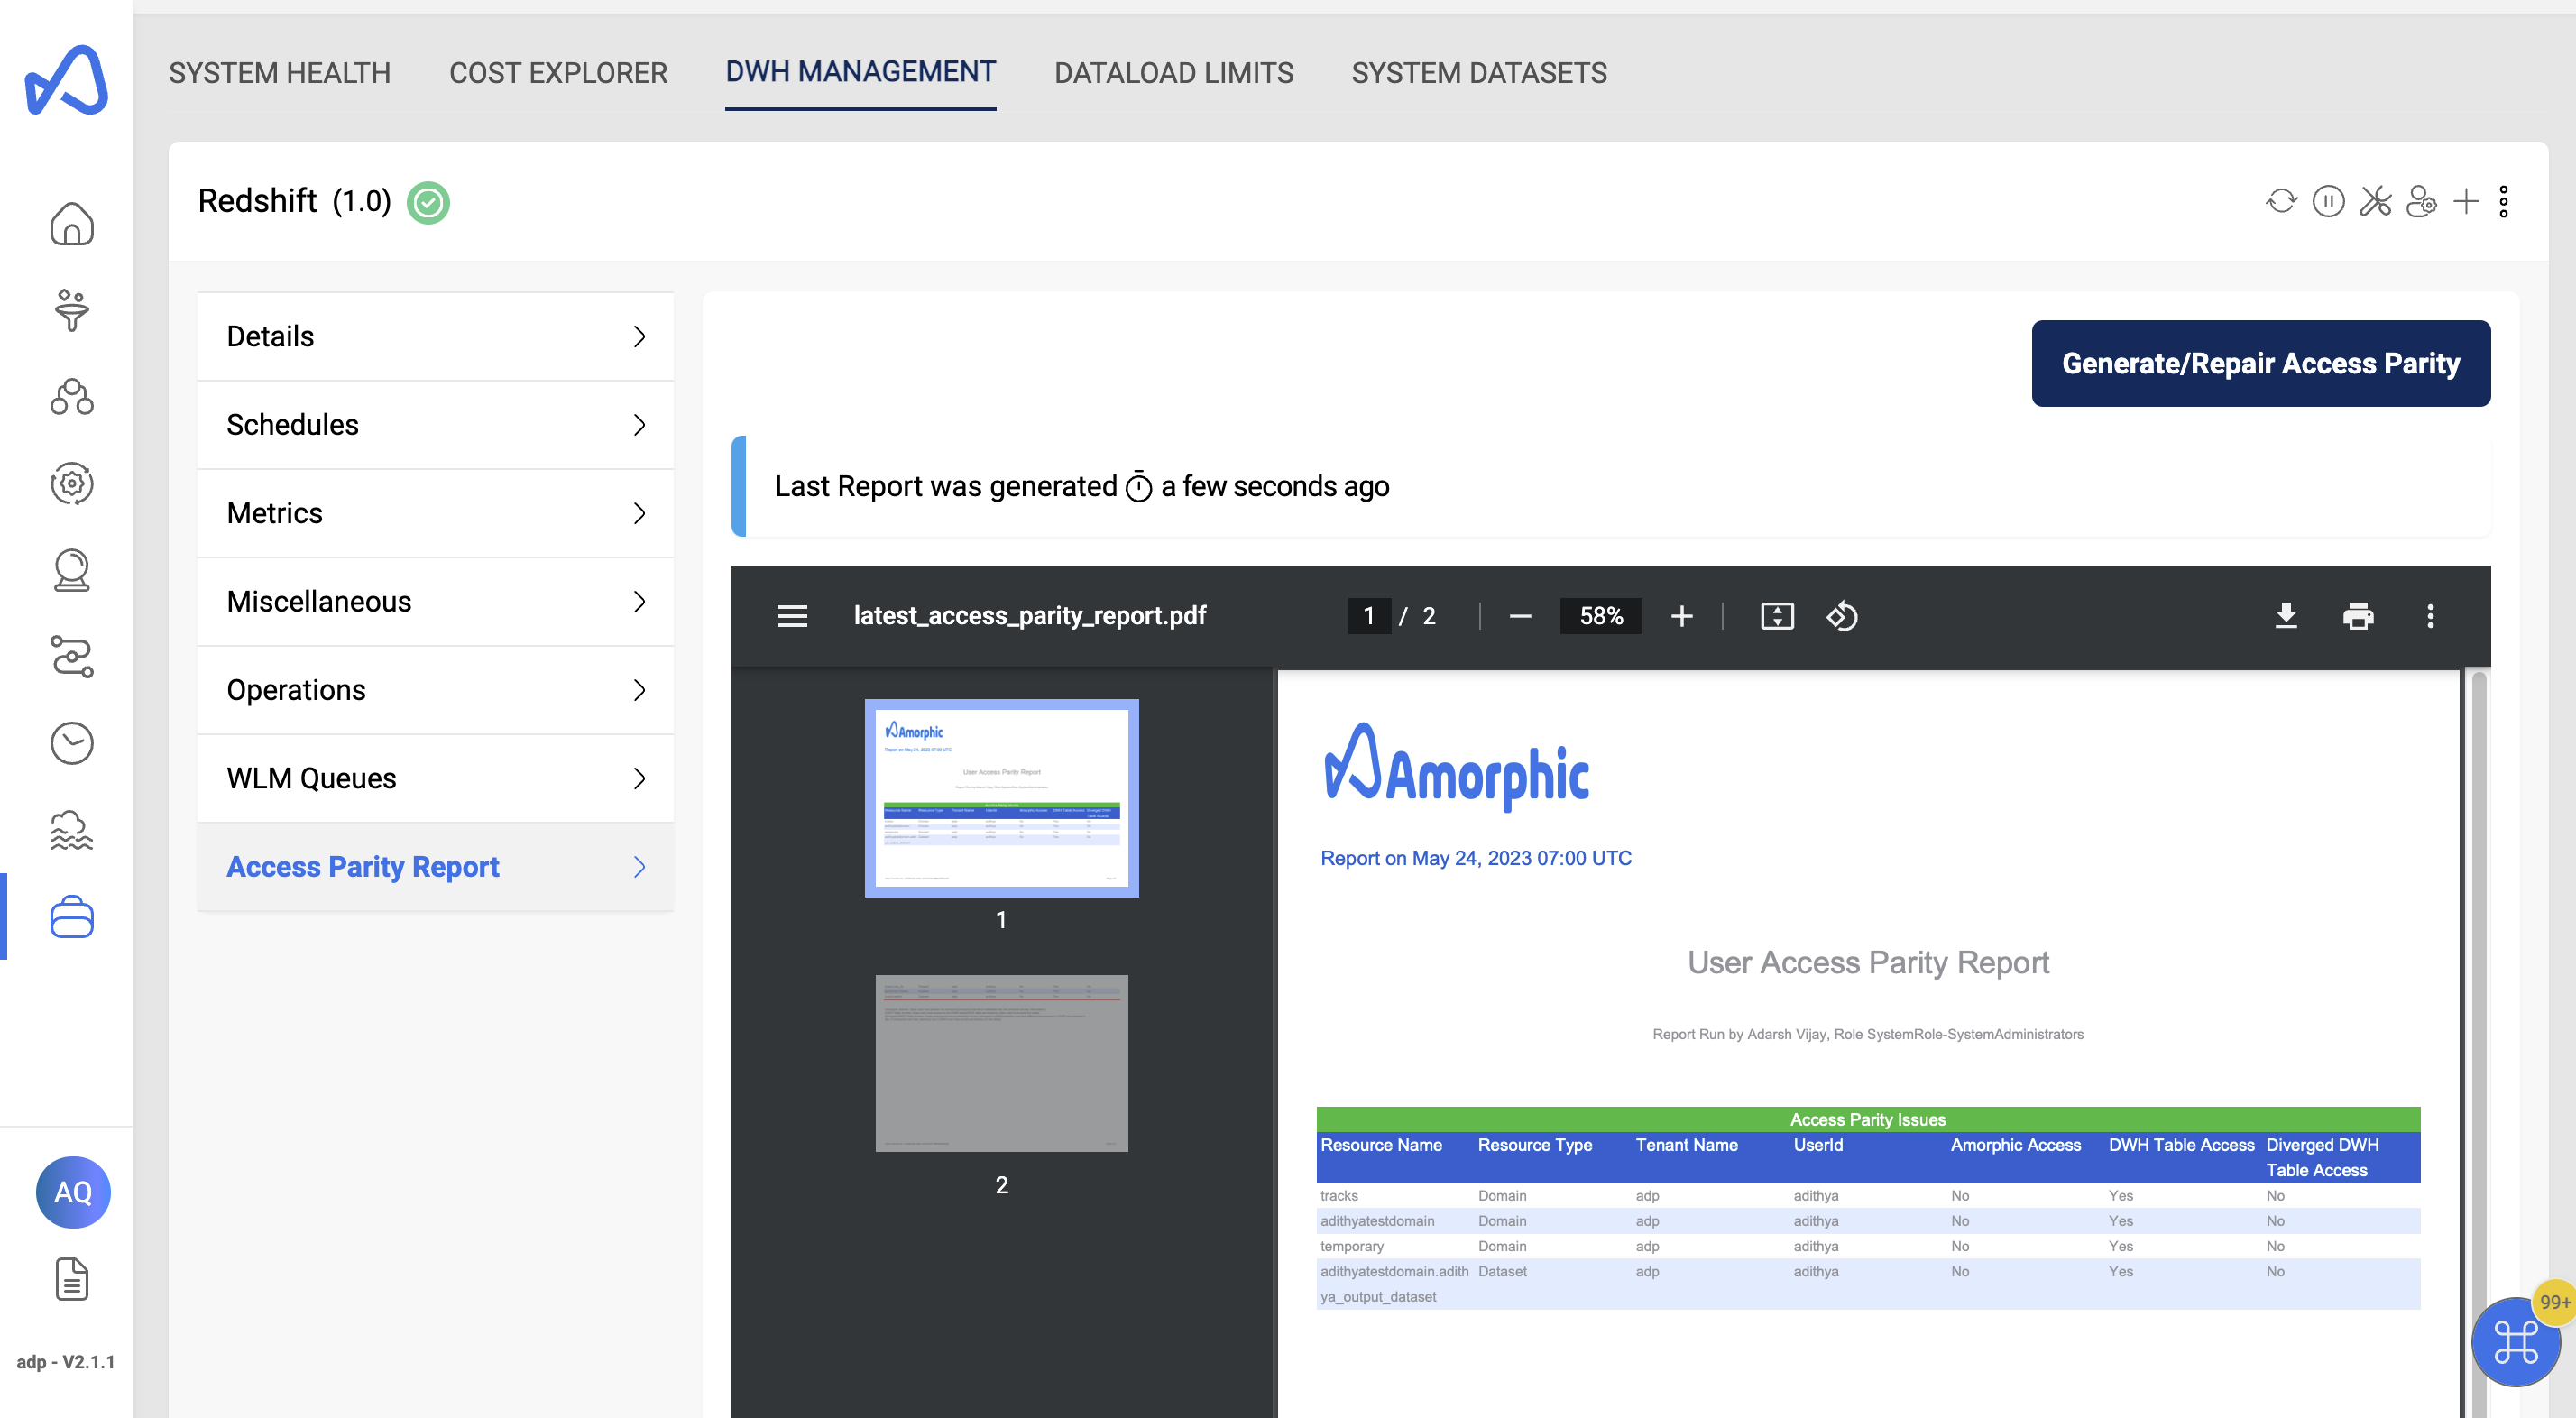
Access Parity Repair/Report
Amorphic admins can generate Access Parity Report, any discrepancies present in DynamoDB and DWH access will be present in the report. Also, admins will receive the Access Parity Report through Email. Admins can also trigger the repair process which will fix the discrepancies. A separate email will be sent to admins with the Access Parity repair Report.
A preview of the latest Access Parity Report will be available in the page like this.
Access Parity Repair/Report processes can be triggered like this.