Metrics
Metrics section in IDP helps you to understand overall system performance related information.
Metrics page is divided into three:
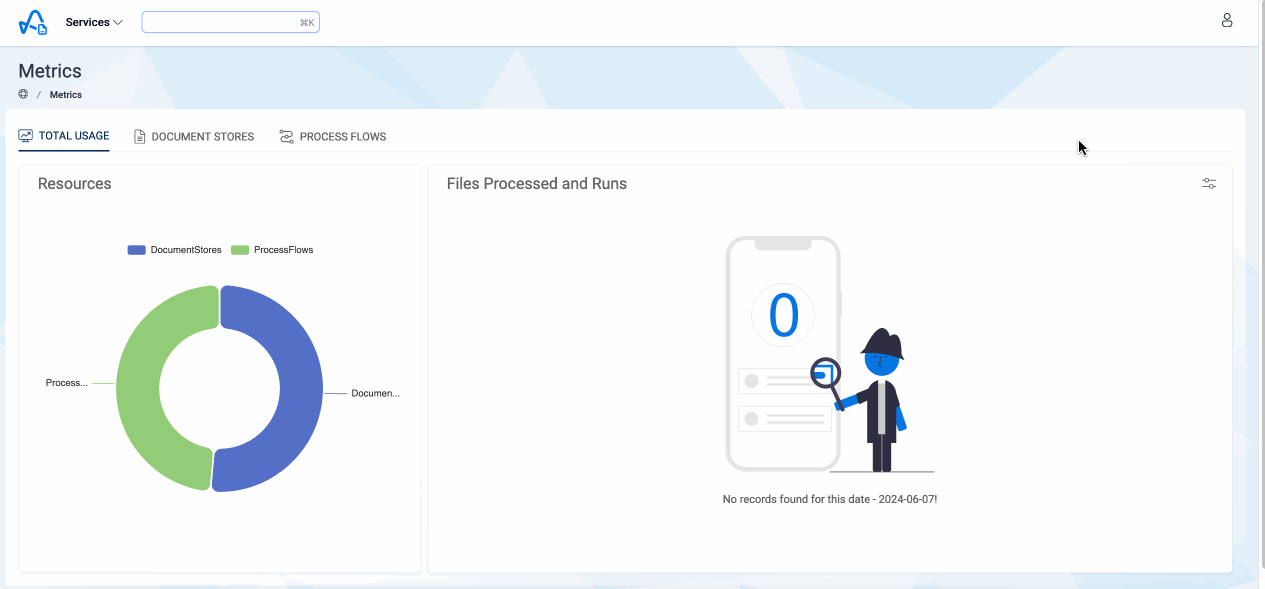
Total Usage
This section gives the idea about the entire system level related metrics.
Resourcespie chart shows the number of Document Stores and Process Flows in the system.Files Processed and Runschart shows the various metrics about the files, runs and pages processed in the entire system.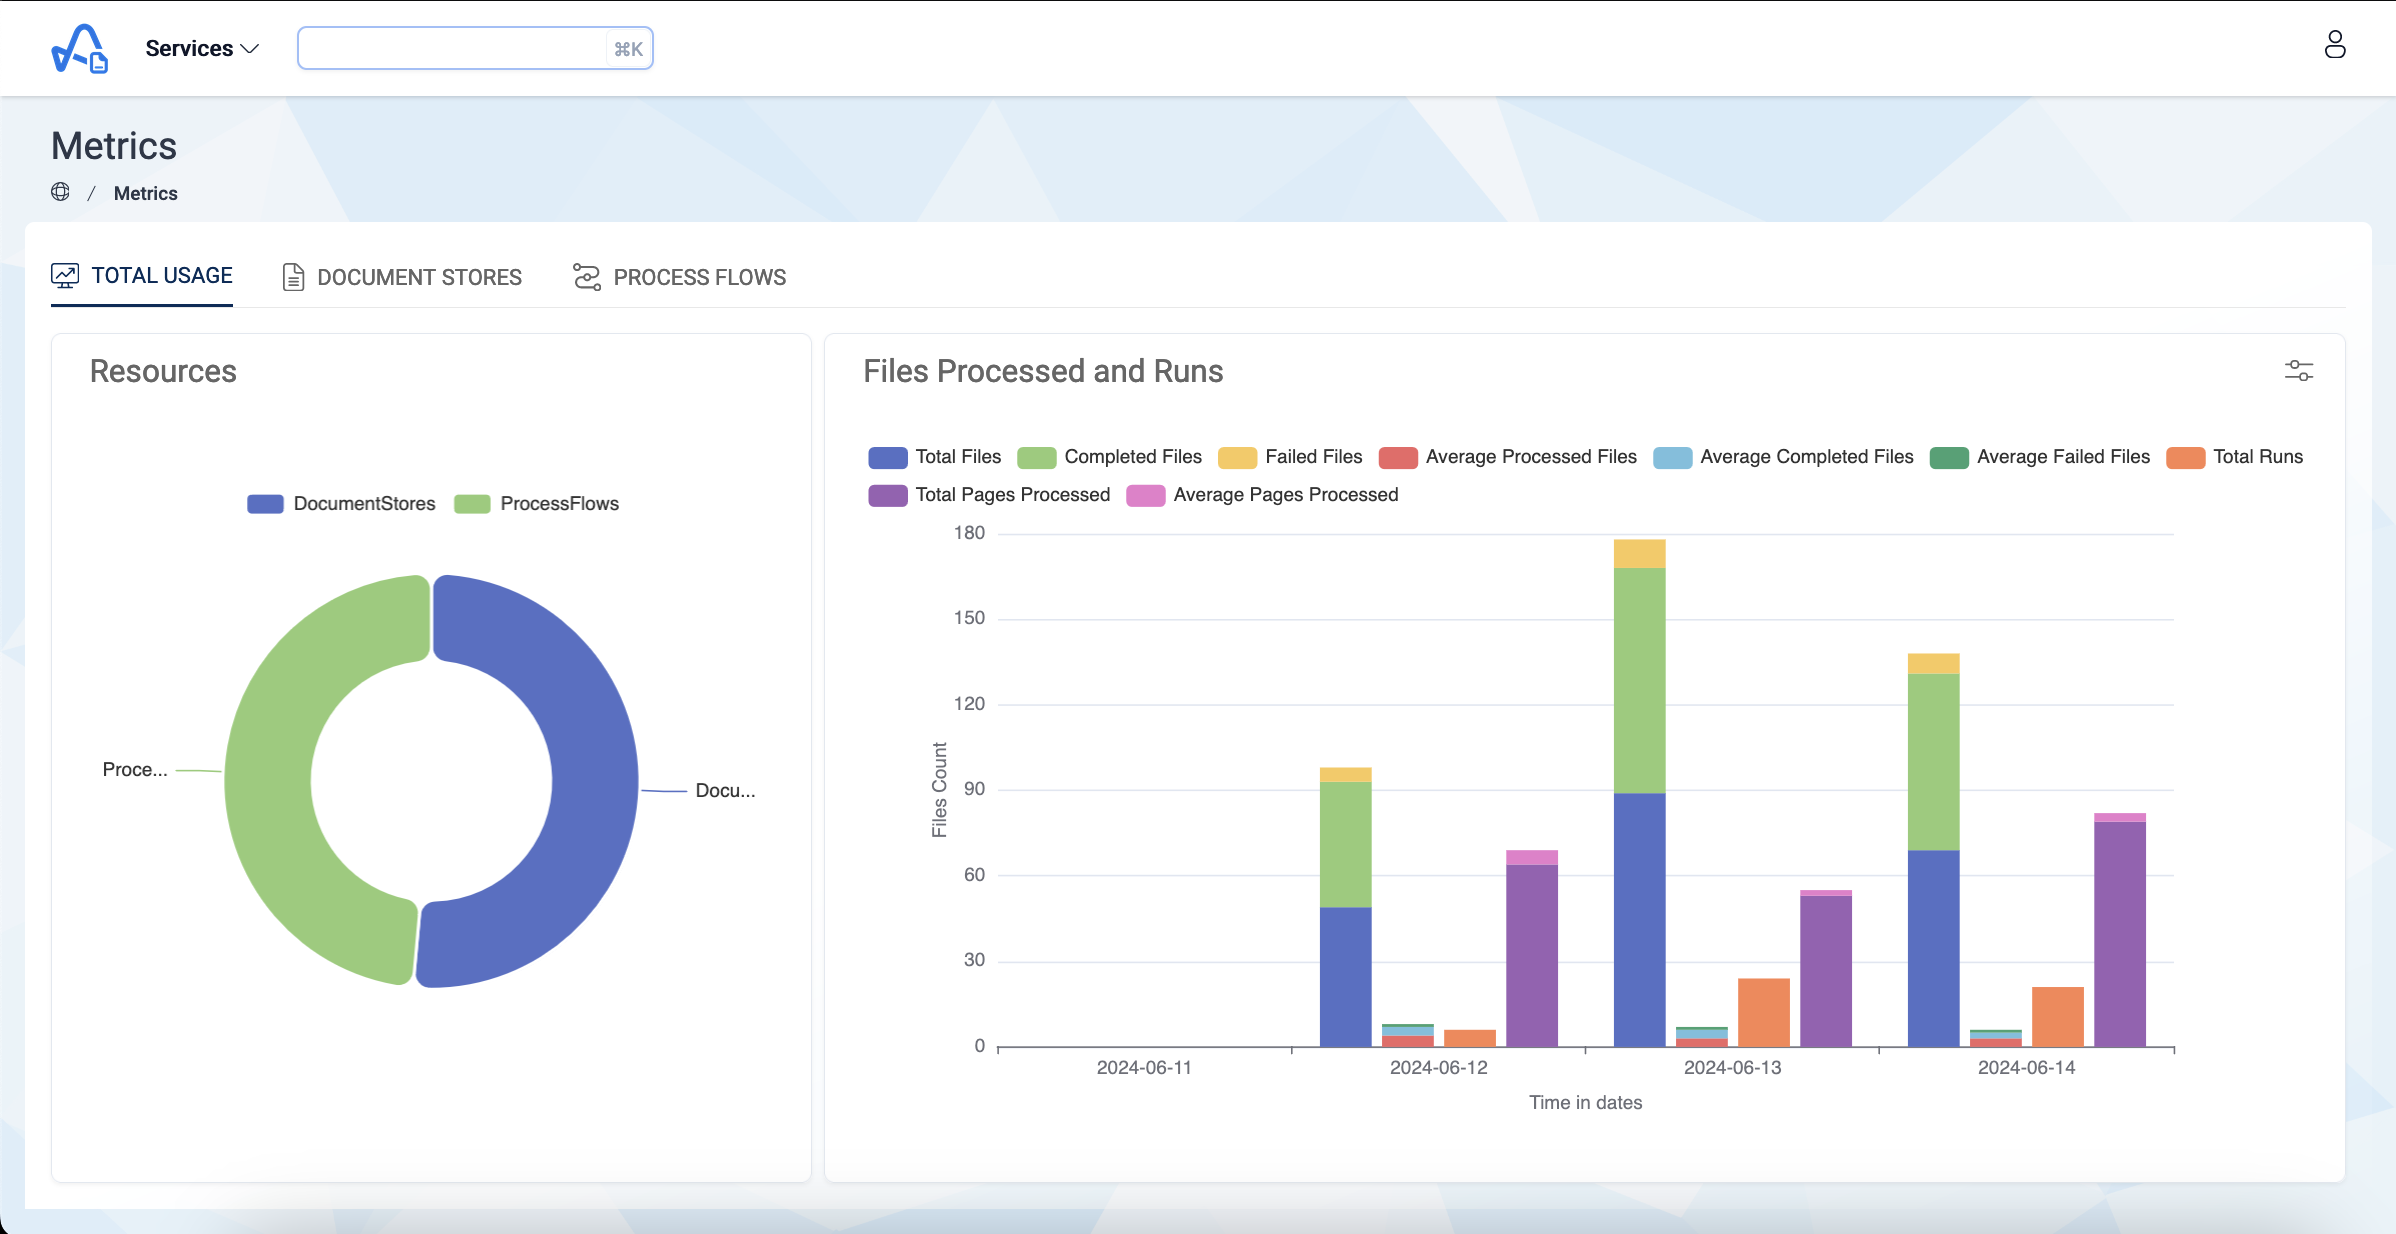
Document Stores
This section is dedicated to show only the usage related to Document Store.
Models Used/Daygraph shows the sum of Total Input and Output AIUs(Amorphic IDP Units) consumed by each model on a per hour basis for the selected date.Files Processed and Runsgraph shows the various metrics related to the files, runs and pages processed across Document Stores.Process Flows
This section is dedicated to show only the usage related to Process Flows.
Models Used/Daygraph shows the sum of Total Input and Output AIUs(Amorphic IDP Units) consumed by each model on a per hour basis for the selected date.Files Processed and Runsgraph shows the various metrics related to the files, runs and pages processed across Process Flows.
How to filter usage metrics for a particular timeframe?
By default Files Processed and Runs graph show the last 7 days data. But users have the option to filter the usage metrics for a particular time so that they can view only the data they are interested in.
User can filter the usage metrics either by hourly(to get data per each hour in a day) or daily to retrieve the data on different days.
Below animation shows how to filter the usage metrics for a particular timeframe: