DWH Management
Data Warehouse Cluster Management feature in Amorphic allows the users to have a birds eye view of the backend DataWarehouse cluster.
Amorphic DWH Management presents the following details:
Core cluster level details such as the cluster type, port, endpoint information and cluster maintenance details.
A simplified view of some of the key cluster metrics Ex: CPU Utilization, DB Connection Counts, Disk Space etc.
Facilitates cluster operations like creating snapshot, update maintenance and reboot etc.
For redshift type DWH, this feature provides additional capabilities such as:
- Run administrative operations on the tables Ex: Vacuuming
- Enables user to run scheduled actions on the cluster Ex: Pause and resuming Cluster
- Enable/disable DWH users to list schemas,tables inside an authorized tenant. For Example : If this option is disabled, users ability to perform catalog discovery will be disabled. i.e users won't be able to list all the tables or schemas under a tenant/database along with the ones the user owns. User capability of querying data will not be affected. In a non multi tenancy environment this option is enabled by default. In a multi tenancy environment all authorized users to use a specific tenant will have the catalog discovery enabled by default.
Other Miscellaneous information such as the Cluster node types and the security configurations.
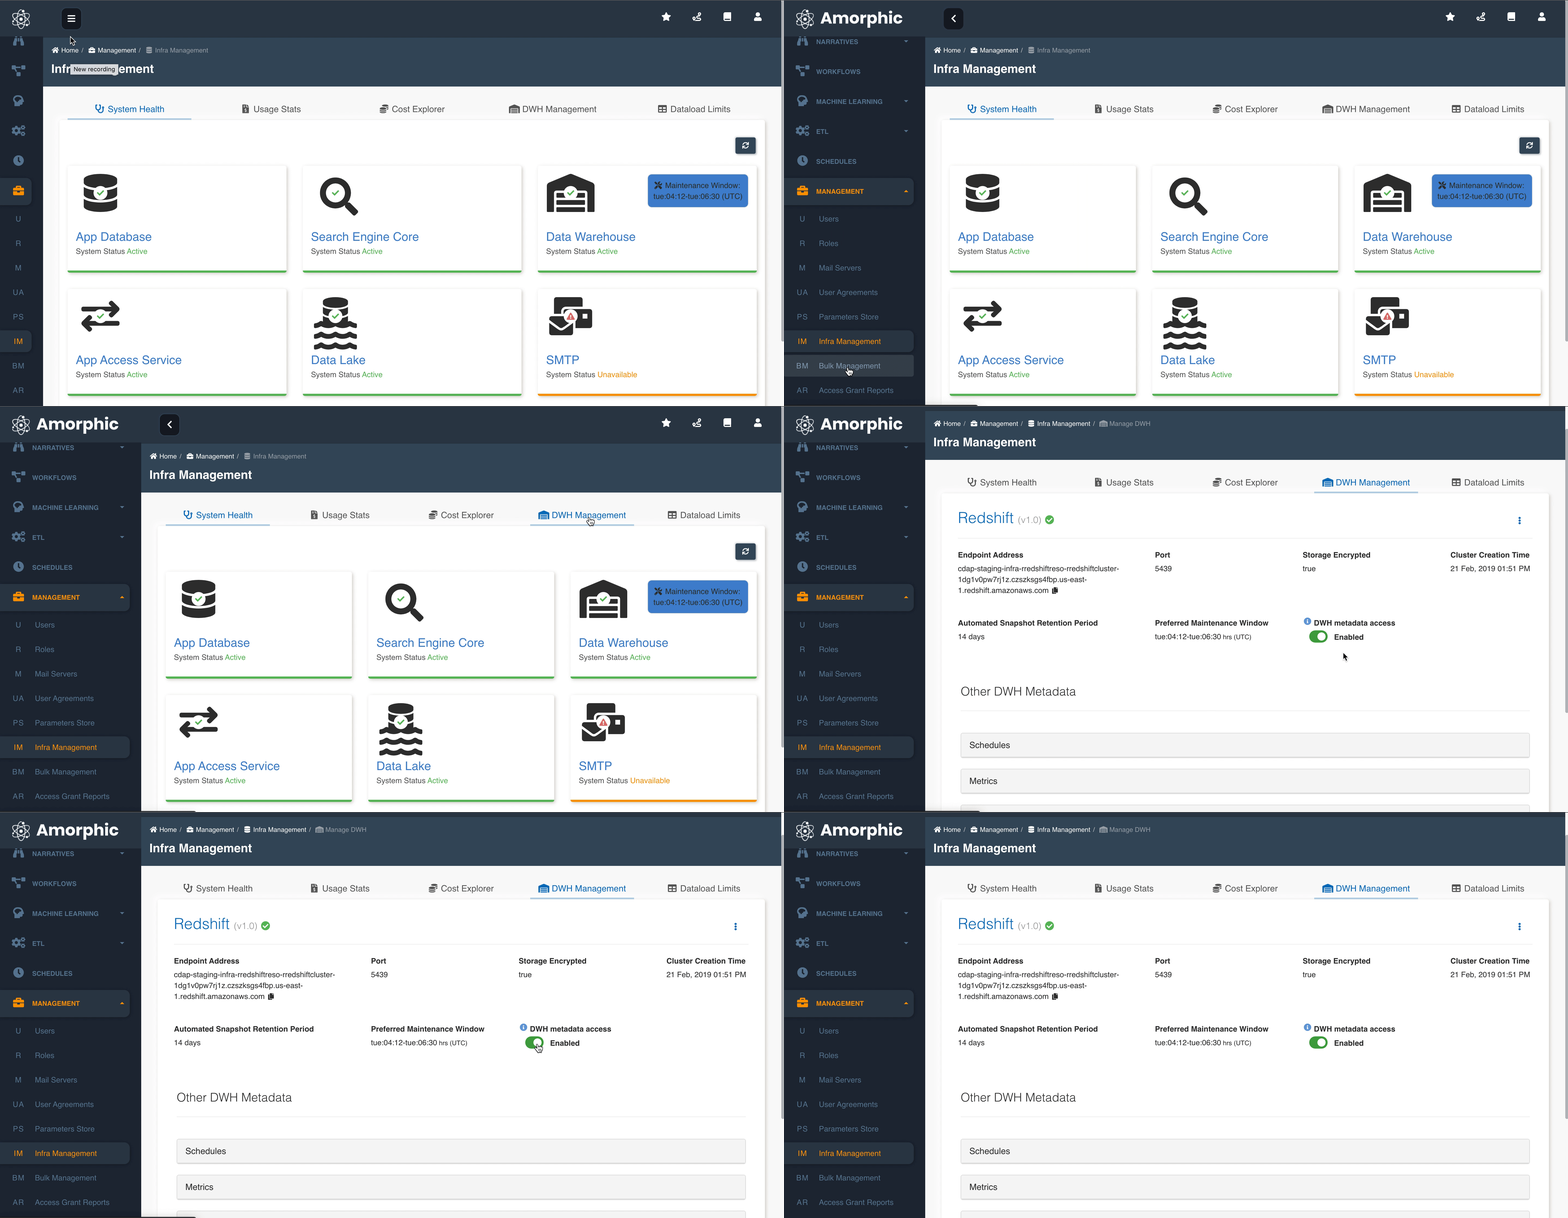
The following picture depicts the DWH Management Console in Amorphic:

Metrics
As understanding cluster metrics is a key for scaling and management of the system, Amorphic DWH management cluster provides an option to view a time line based cluster metrics.The selection console has option to filter through it for quicker selection. Once filtered, the user can quickly view all the cluster metrics. The selection criteria is a time range between 30 mins to a week. By default the management page shows the last 30 minute metrics.
Below are the available metrics:
CPU Utilization
- Shows the percentage of CPU utilization for all nodes.
- Units: Percent
Database Connection Count
- The number of database connections to a cluster.
- Units: Count
Health Status
- Indicates the health of the cluster.
- Units: Count( 1-HEALTHY / 0-UNHEALTHY ).
Network Receive Throughput
- The rate at which the node or cluster receives data.
- Units: Bytes/Second
Percentage Disk Space Used
- The percent of disk space used.
- Units: Percent
WLM Queue Wait Time
- The total time queries spent waiting in the workload management (WLM) queue.
- Units: Milliseconds.
WLM Running Queries
The number of queries running from both the main cluster and concurrency scaling cluster per WLM queue.
Units: Count
The following table lists the IDs assigned to service classes.
ID Service Class 1–4 Reserved for system use 5 Used by the superuser queue 6-13 Used by manual WLM queues that are defined in the WLM configuration 14 Used by short query acceleration 15 Reserved for maintenance activities run by Amazon Redshift 100-107 Used by automatic WLM queue when auto_wlm is true
Operations
Amorphic DWH management cluster console provides a handful of key operations such as:
- Creating a snapshot
- Update cluster maintenance window
- Reboot cluster
- Pause and Resume cluster ( only for Redshift type cluster )
- Running Vacuuming on tables ( only for Redshift type cluster )
- Running System Administrator queries ( only for Redshift type cluster )
- DWH Metadata Access ( only for Redshift type cluster )
The following picture depicts the DWH Management Console Actions in Amorphic:

Creating Snapshot
Management console allows users to create manual snapshots with customizable retention period of the cluster. Valid retention period is between 1-3653 days.

Update cluster maintenance window
Enables users to update the scheduled cluster maintenance window. Supported format : ddd:HH:MM-ddd:HH:MM

Rebooting Cluster
Enables users to reboot an active cluster.

Pause and Resume Cluster
Amorphic management console allows users to pause and resume their redshift cluster with customizable schedule. This option is only supported for redshift type DW clusters. The supported actions are:
- Pause Now : Pause the cluster immediately
- Pause Later : Pause the cluster at a give time stamp
- Pause and Resume Later: Schedule a pause and resume action at a defined period. Example : Pause on every friday 10:00 PM and resume on monday morning 9:00 AM
- Resume Now : Resume the cluster immediately
- Resume Later: Resume the cluster at a give time stamp
- Resume and Pause Later: Schedule a resume and pause action at a defined period. This action is similar to Pause and resume later defined above.

Vacuuming
Enables user to run vacuuming on the database tables. Currently Vacuuming is only supported on redshift cluster type backend. Amorphic does support all types of vacuuming such as FULL, SORT ONLY, DELETE ONLY AND REINDEX.
- FULL : Default option, Reclaims disk space occupied by rows that were marked for deletion by previous UPDATE and DELETE operations. VACUUM FULL skips the sort phase for any table that is already at least 95 percent sorted.
- SORT ONLY : Sorts the specified table without reclaiming space freed by deleted rows. - DELETE ONLY : Reclaims disk space occupied by rows that were marked for deletion by previous UPDATE and DELETE operations, and compacts the table to free up the consumed space. A DELETE ONLY vacuum operation doesn't sort table data.
- REINDEX : Analyzes the distribution of the values in interleaved sort key columns, then performs a full VACUUM operation. VACUUM REINDEX isn't supported with TO threshold PERCENT.
Threshold Percent is a clause that specifies the threshold above which VACUUM skips the sort phase and the target threshold for reclaiming space in the delete phase.

Administrator Queries
Enables users to run administrator level queries on the database cluster. Amorphic supports the following actions
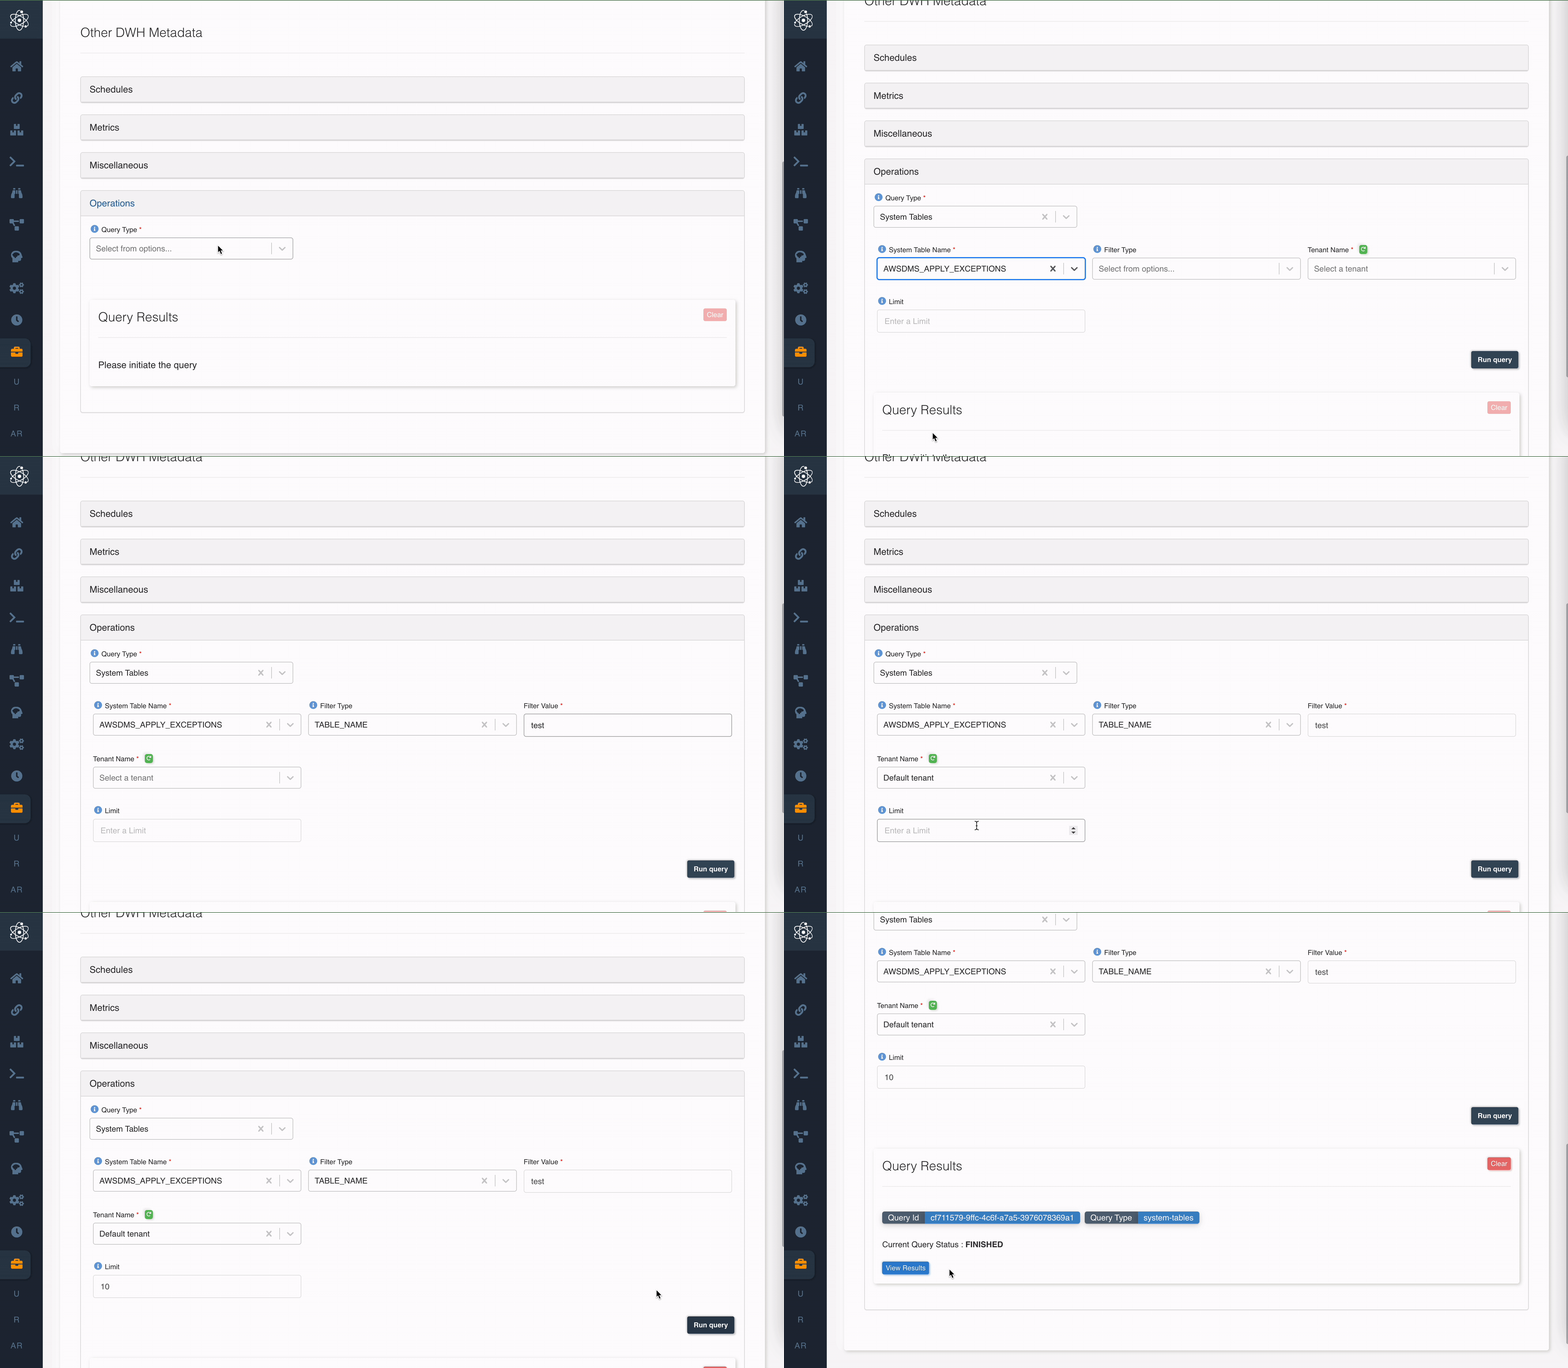
- Query System Tables : Fetch table load, Work load management, S3 client errors and list table locks. Amorphic provides advanced querying options to enable conditional filtering of the results. Example : User can fetch work load errors based on the error code or message.
- Kill Sessions/Queries : Reclaims disk space occupied by rows that were marked for deletion by previous UPDATE and DELETE operations, and compacts the table to free up the consumed space. A DELETE ONLY vacuum operation doesn't sort table data.

Query System tables
Amorphic allows querying the following system tables
STL_LOAD_ERRORS : Contains a history of all Redshift load errors.

STL_S3CLIENT_ERROR : Records errors encountered by a slice while loading a file from Amazon S3.

STL_WLM_ERROR : Records all Work load management related errors as they occur.

STL_TR_CONFLICT : Records all transaction conflicts with database tables.

STV_SESSIONS : Lists all current active cluster connections.

STV_RECENTS : Lists all current running queries.

STV_LOCKS : Lists all existing table locks.

AWSDMS_APPLY_EXCEPTIONS : Provides information about DMS exceptions
Kill Sessions/Queries
Amorphic allows user to kill the sessions and queries.

DWH Metadata Access
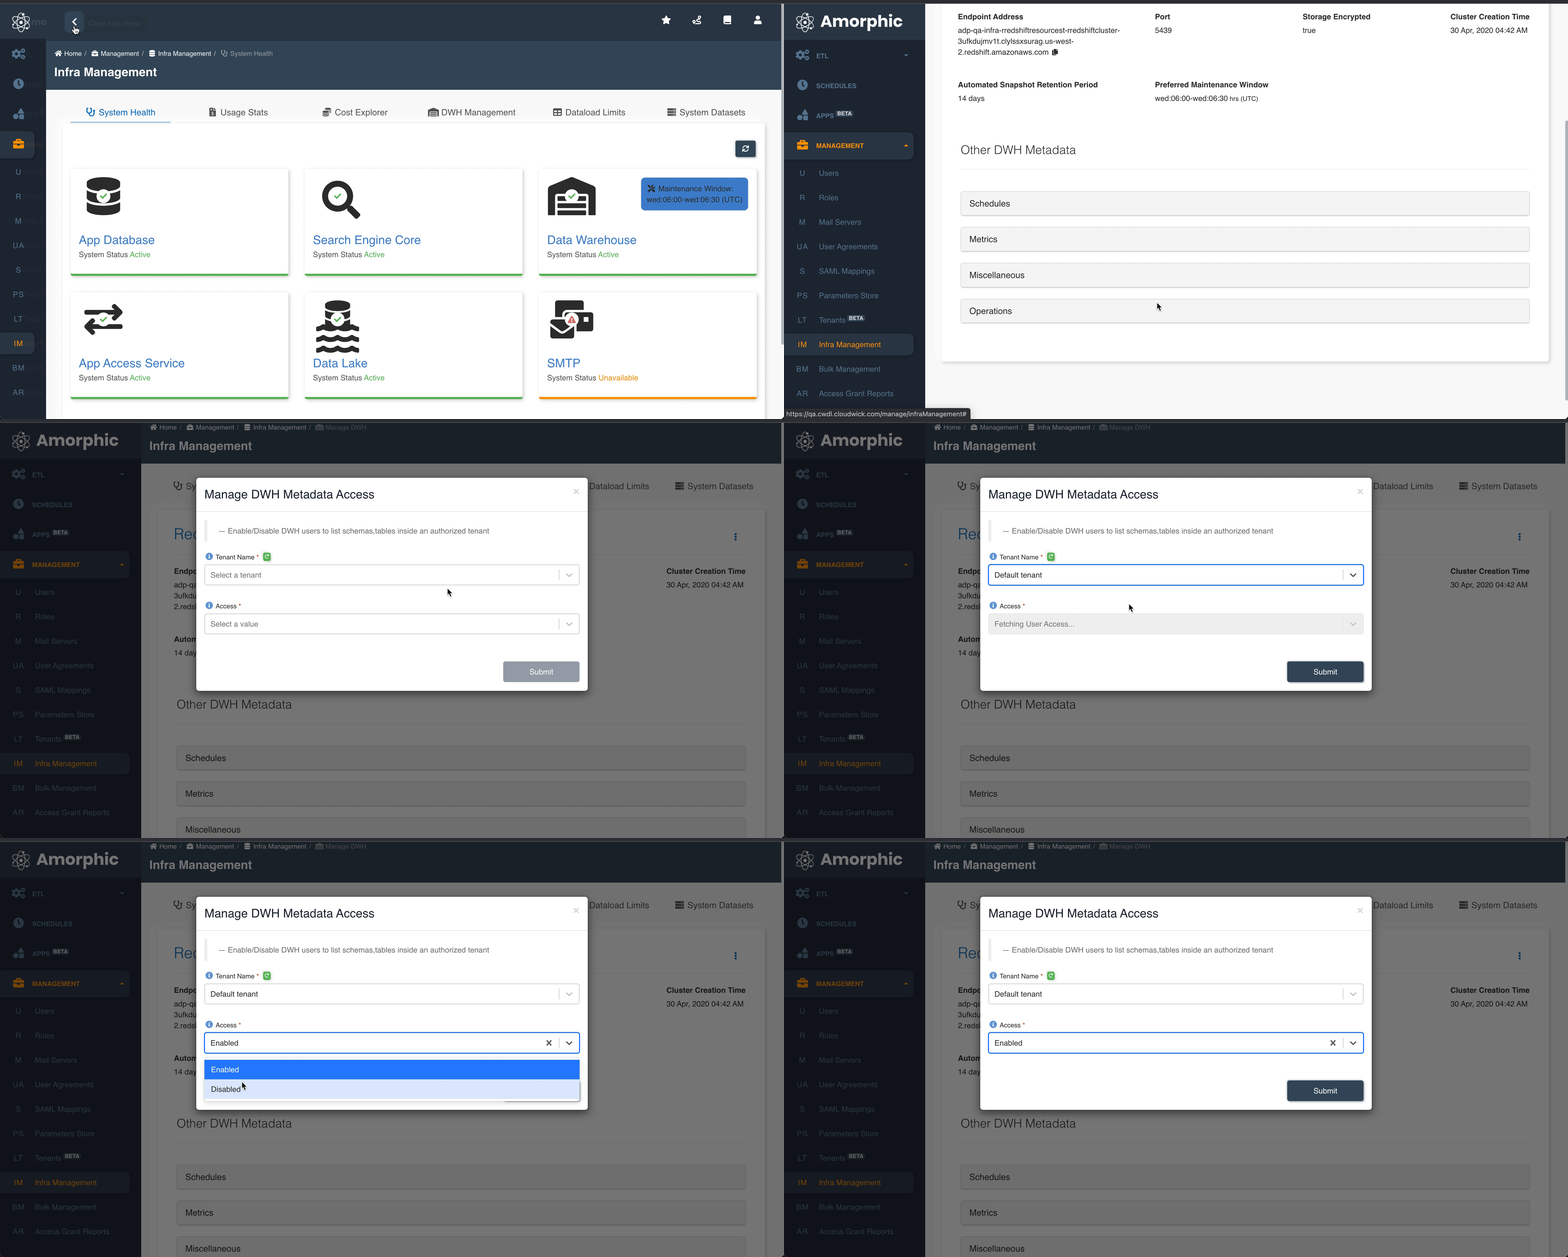
Amorphic allows user to Enable/disable DWH users to list schemas, tables inside an authorized tenant.
Non Multi tenancy environment
In Multi tenancy environment, user can list and choose the authorized tenant which it is a part of and update the user catalog access.
WLM Queues
Amorphic management console allows users to create, edit and delete Redshift Workload Management queues so that user queries are appropriately routed and picked based on the priority of the user's work.
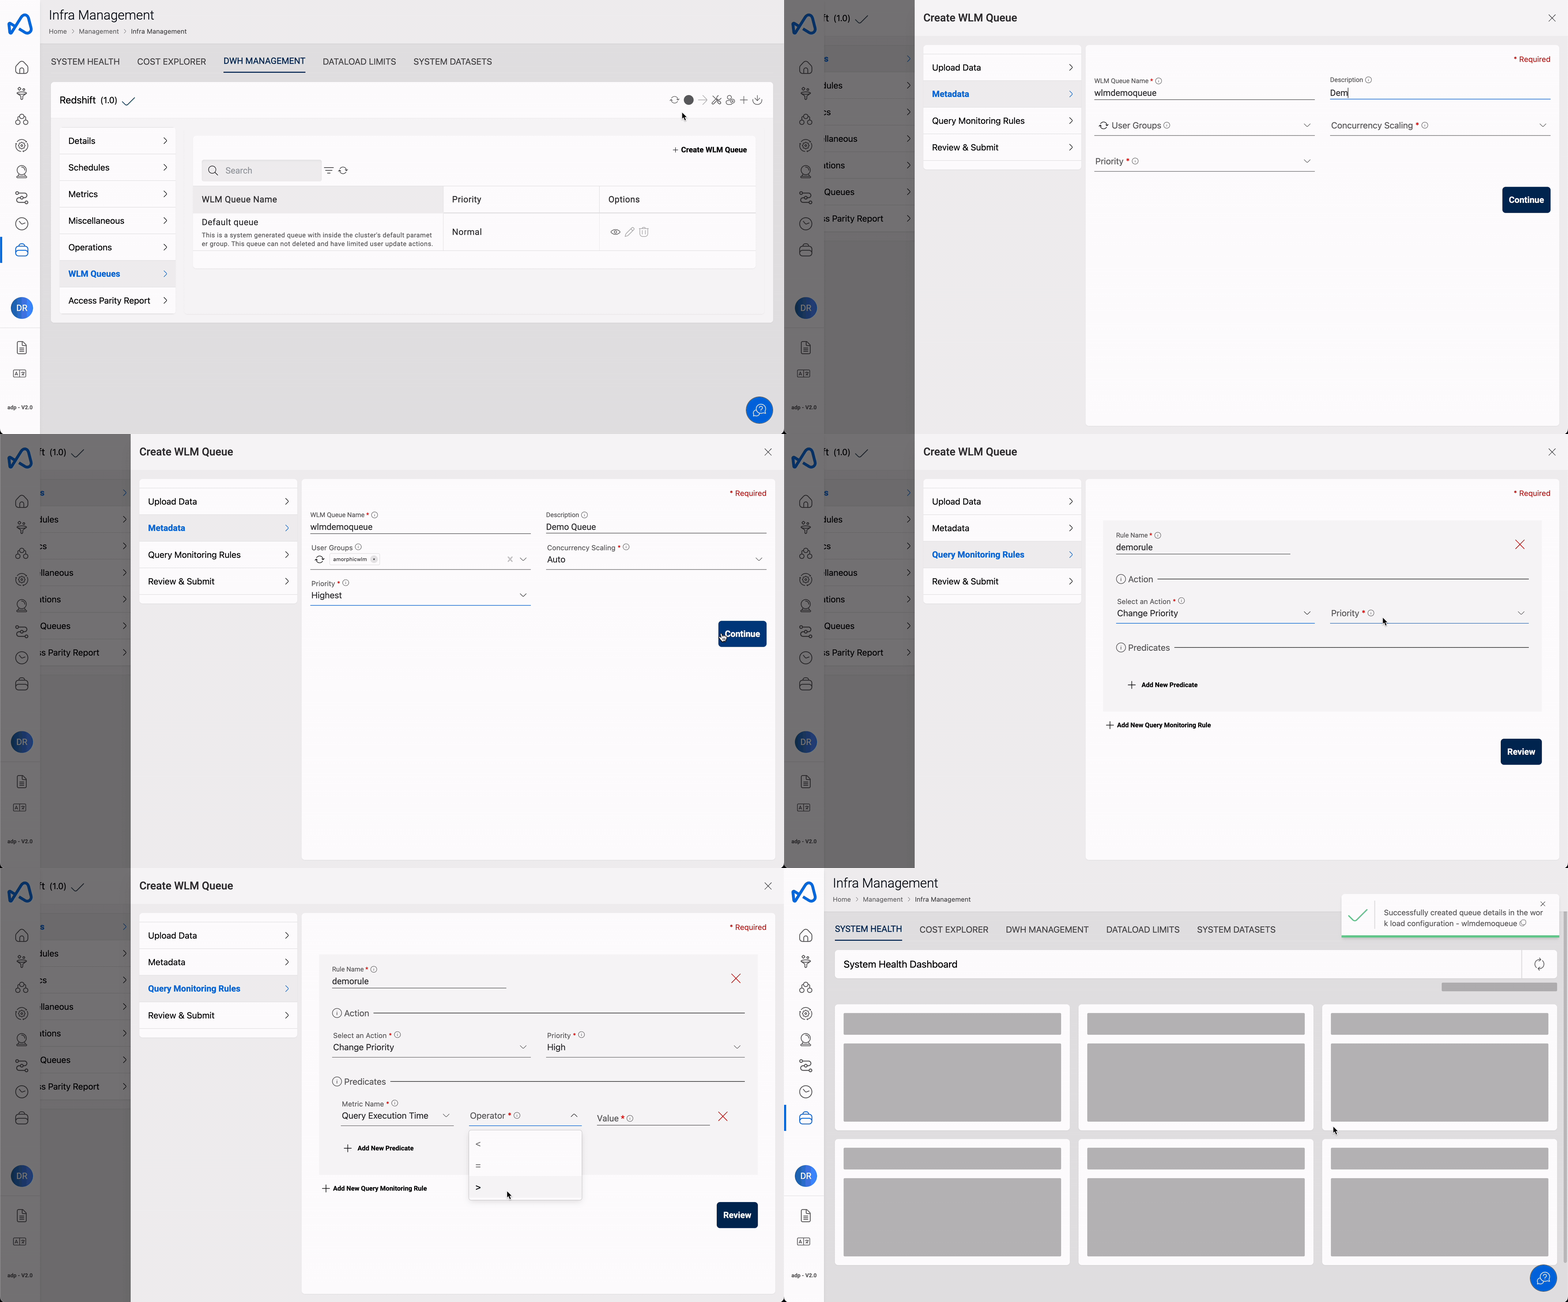
When users turn on concurrency scaling, Amazon Redshift automatically adds additional cluster capacity to process an increase in both read and write queries. Users can define the relative importance of queries in a queue by setting a priority value. The priority is specified for a queue and inherited by all queries associated with the queue.
Users can define query monitoring rules as part of workload management (WLM) configuration. Query monitoring rules define metrics-based performance boundaries for WLM queues and specify what action to take when a query goes beyond those boundaries.
Each rule includes up to three conditions, or predicates, and one action. A predicate consists of a metric, a comparison condition (=, <, or > ), and a value. If all of the predicates for any rule are met, that rule's action is triggered. Possible rule actions are log, abort and change priority.
Below are the valid metrics and their minimum and maximum values.
| Metric Name | Min Value | Max Value |
|---|---|---|
| Query Execution Time | 0 | 86399 |
| Query Queue Time | 0 | 86399 |
| Query CPU Time | 0 | 999999 |
| Blocks Read | 0 | 1048575 |
| Scan Row Counts | 0 | 999999999999999 |
| Memory to Disk | 0 | 319815679 |
| CPU Skew | 0 | 99 |
| I/O Skew | 0 | 99 |
| Rows Joined | 0 | 999999999999999 |
| Nested Loop Join in Row Count | 0 | 999999999999999 |
- A maximum of 15 queues can be created.
- An overall of 25 rules can be applied on all queues
- There can be maximum 3 predicates per rule
Access Parity Report
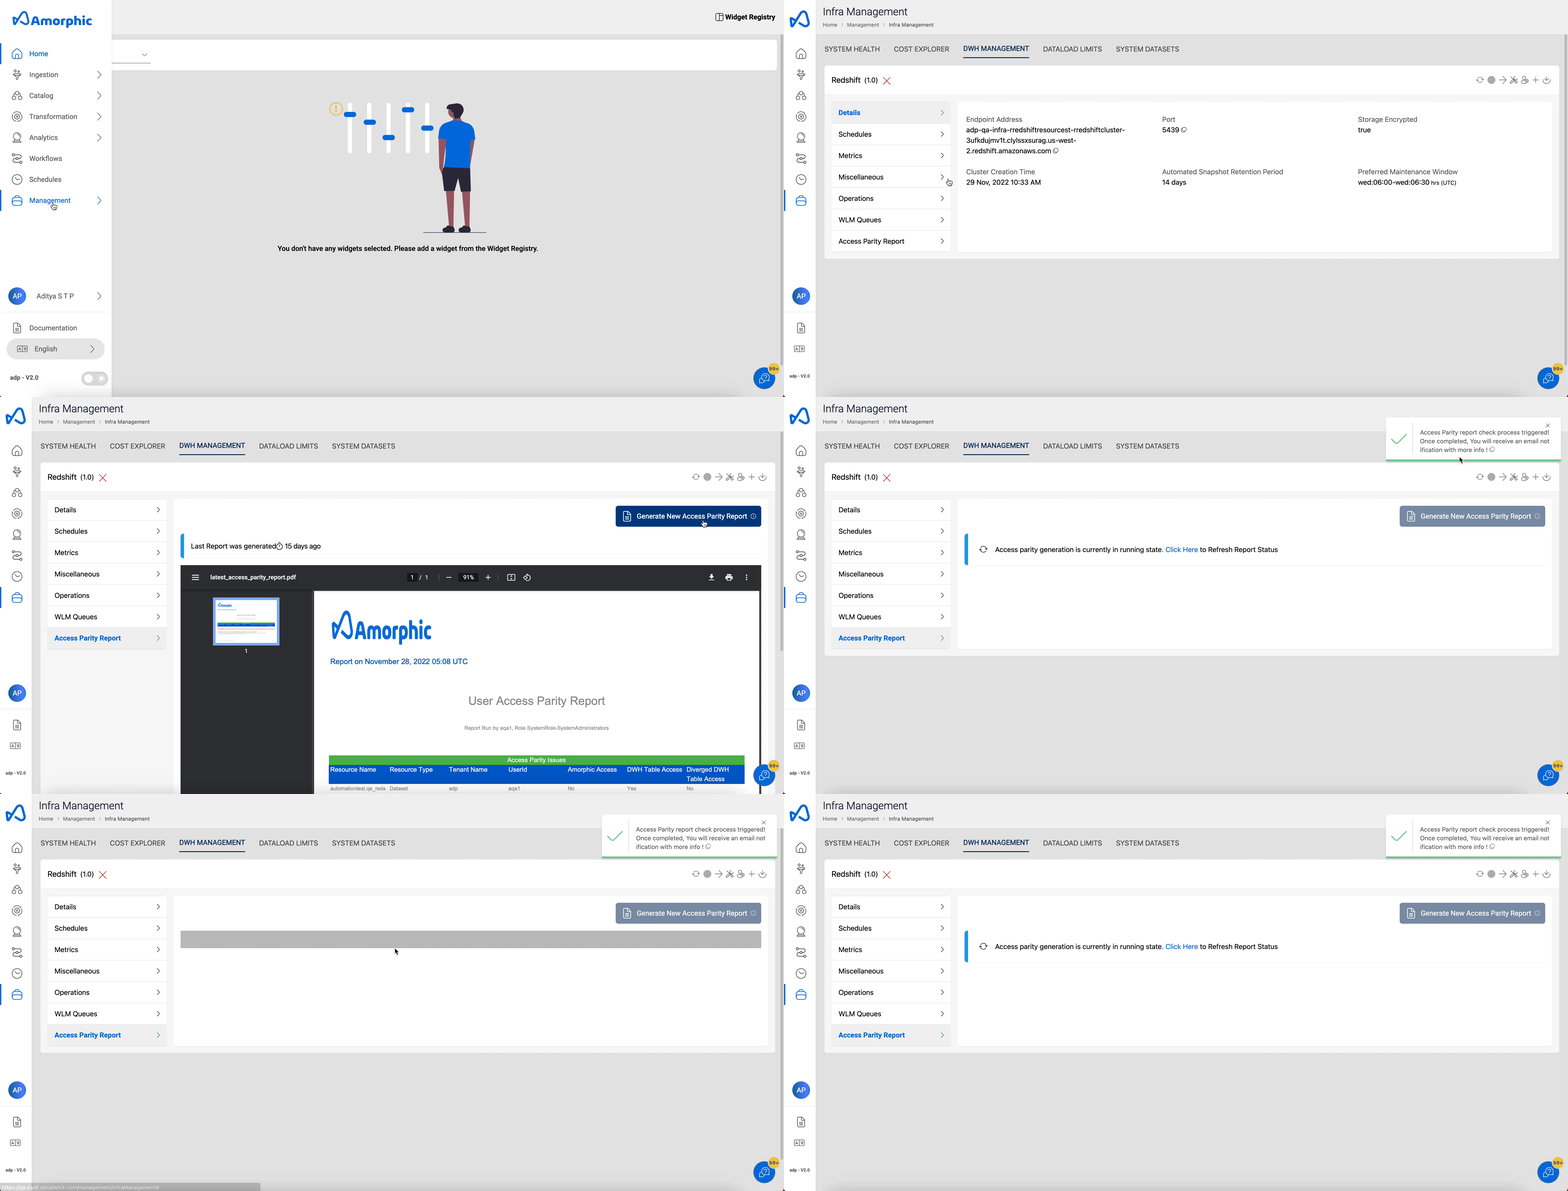
Amorphic admins are allowed to generate Access Parity Report, Any discrepancies present in DynamoDB and DWH access will be present in the report.
Admin will recieve the Access Parity Report as well as User Batch repair will be triggered automatically for the remedies of the issues and a separate email will be received by admins with Access Parity Remeady Report as well.
